In this section: |
You can watch the monitoring state in the Monitoring View. The monitoring window can be connected to a running batch or to a running online server, where it shows the progress of the connected server.
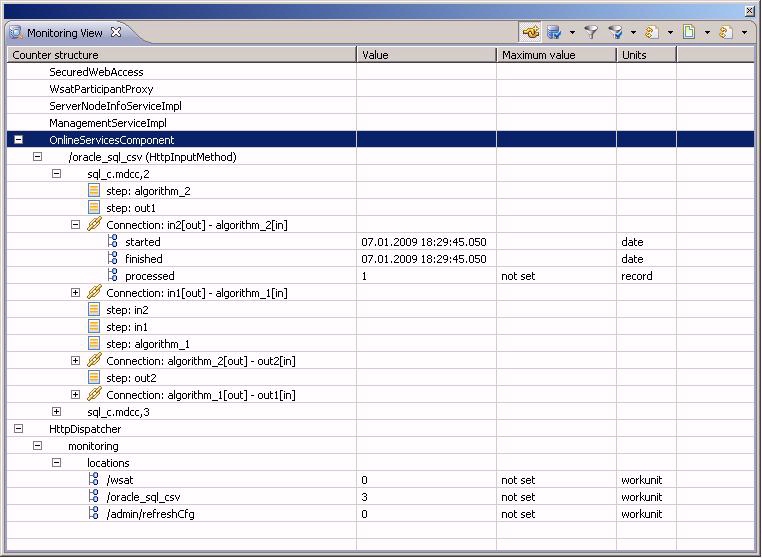
The following image shows a sample Monitoring View.
The Monitoring View generally contains a hierarchical structure, and leafs are counters that are basically numbers. This structure is shown after connecting to the batch. The upper level contains a list of steps and connections. The component step contains the same structure as the component configuration file if it were used as a single running configuration file.
The server has a number of components, which are shown on the upper level. Each component can have a structure and counters. The online component shows all just-processed requests. Each request is run by calling a location. On each location, there can be more configuration files being processed.
If the upper level displays the steps and connections for a configuration file, then you can filter these steps and connections by synchronizing the Monitoring View with the editor in which the just-run configuration file is open. Only selected steps or connections are shown.
There are three ways of adjusting the display of the structure:
The counters and even the hierarchical structure (when viewing the online server) change, and therefore you want to refresh the view. You can also set the refresh to occur automatically.
You can store the state of counters. You can then load the state as background counters for comparison to the current state.
The hierarchical structure can be complex. It may be useful to view only a part of the structure. You can drill down to a part of the structure.
| iWay Software |