-
Right-click
the process flow you want to test and select Test,
then Run from the drop-down list.
The Testing Process - Locate a Test Server dialog box opens, as shown in the following image.
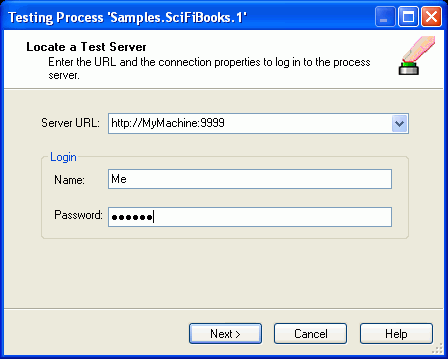
- In the Server URL field, type the address of the Service Manager where you want to test the process flow.
- In the Login area, type the user name and password in the corresponding fields to access Service Manager.
-
Click Next.
The Override Register Values dialog box opens, as shown in the following image.
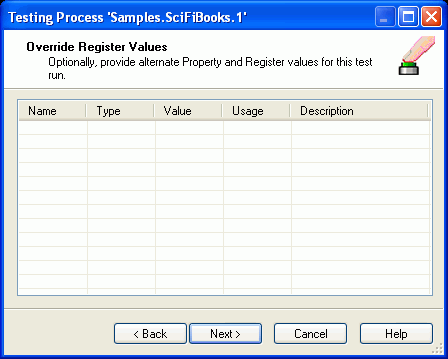
- In the Override Register Values dialog box, you can enter SREG values to be used in the process flow that will override the values set through either the iWay Service Manager conosle, server configuration, or Register Sets.
-
Click Next.
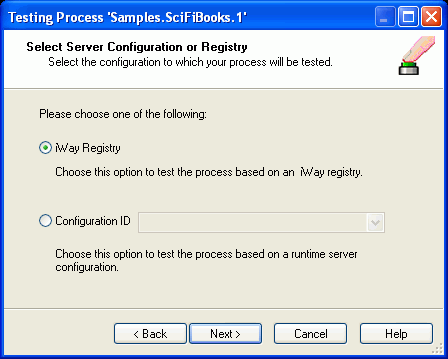
The Select Server Configuration or Registry dialog box opens, as shown in the following image.
-
Select either the iWay Registry or Configuration ID option.
If you select Configuration ID, then select the Service Manager
configuration on which you will run the test from the drop-down
menu.
Note:
- Designer allows tesing of process flows in the Registry environment and in configured run-time servers.
- The Test, Run option always includes an automatic compilation, regardless of whether or not you compiled the process flow before testing.
-
Click Next.
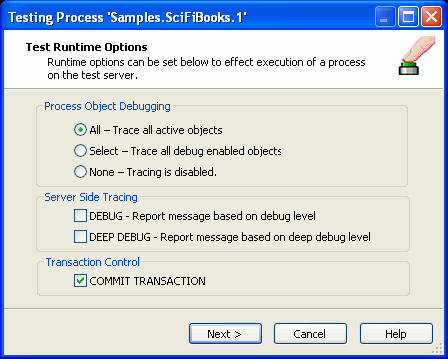
The Test Runtime Options dialog box opens, as shown in the following image.
-
Select
the Process Object Debugging option, as follows:
All - traces all active objects.
Select - traces all debug enabled objects.
None - disables tracing.
-
Select
the trace levels, as needed.
DEBUG - reports progress traces of the test.
DEEP DEBUG - reports additional traces and details about errors.
-
Choose
whether or not to set the Transaction Control option, COMMIT TRANSACTION.
This determines whether or not the work scheduled in the process flow is actually performed during the test, for example, inputting records to a database.
-
Click Next.
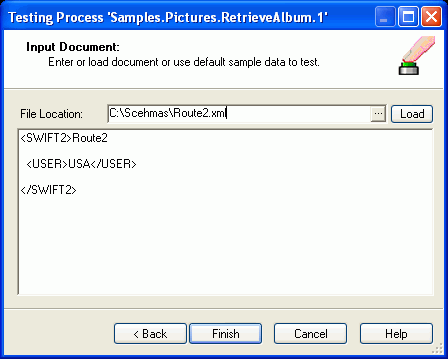
The Input Document dialog box opens.
-
Click
the ellipsis (...) to open the Select Tested File dialog box, in
which you can either type a path to the input XML document or browse
to its location. Click Open when the file
is located.
The following image is an example of the Input Document dialog box with a selected XML document.
-
Click Finish.
The test results appear in the Message Log pane and a window opens with the following message:
The current selected process has successfully been tested. Do you want to view the detail results?
-
To see
detailed test results in the Process Test Viewer window, click Yes.
The Process Test Viewer window opens, with the Traces node selected on the left and the trace information displayed on the right. The following is an example of this window showing the Trace results for the process flow named Samples.SciFiBooks.1.
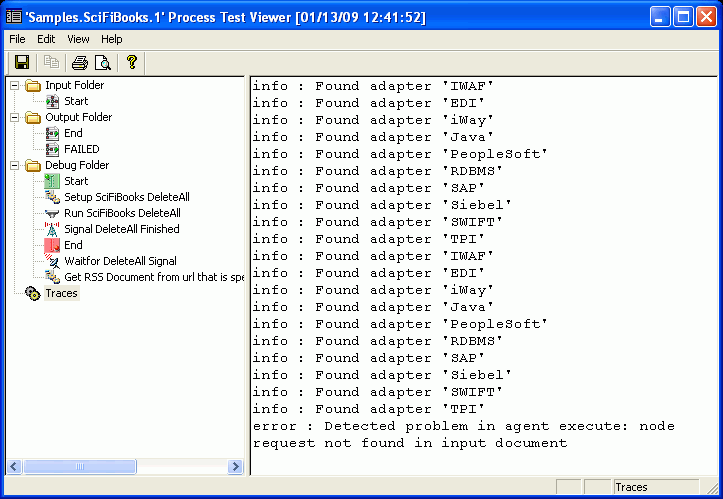
Note: To view the most recent test results of a process flow, right-click the process flow in the Navigator pane and select Test and View, or select the process flow and from Build the menu, select Test and View.
The following is an example of test results that appear in the Message Log pane for a process flow named Samples.SciFiBooks.1 with the Debug trace level selected.
---------- Testing the Process
----------
Sending testing request to server...
Getting server response... info: Found adapter 'IWAF'
info: Found adapter 'EDI'
info: Found adapter 'iWay'
info: Found adapter 'Java'
info: Found adapter 'PeopleSoft'
info: Found adapter 'RDBMS'
info: Found adapter 'SAP'
info: Found adapter 'Siebel'
info: Found adapter 'SWIFT'
info: Found adapter 'TPI'
info: Found adapter 'IWAF'
info: Found adapter 'EDI'
info: Found adapter 'iWay'
info: Found adapter 'Java'
info: Found adapter 'PeopleSoft'
info: Found adapter 'RDBMS'
info: Found adapter 'SAP'
info: Found adapter 'Siebel'
info: Found adapter 'SWIFT'
info: Found adapter 'TPI'
debug: No flow timeout specified, so default of 10 seconds has been set for this test. To change, set a specific flow timeout property.
debug: xable - flow root
debug: xable - flow start
debug: setting flow variable xtrack=full
debug: setting flow variable Debug=true
debug: setting flow variable schema=Any
debug: setting flow variable location=schemas\any.xsd
debug: setting flow variable roottag=request
debug: setting flow variable timeout=0
debug: setting flow variable debug=false
debug: node Start retList[0]: success
debug: xdpflow starting new flow flowTest.1 edgecount=2
debug: node Setup SciFiBooks DeleteAll retList[0]: success
debug: node Run SciFiBooks DeleteAll retList[0]: success
debug: node Signal DeleteAll Finished retList[0]: success
debug: Ending pflow, subthreads=0
debug: evaluate for COND(SREG(Event1),eq,DeleteAllDone) returns: true
debug: node Waitfor DeleteAll Signal retList[0]: success
error: Detected problem in agent execute: node request not found in input document
debug: node Get RSS Document from url that is specified in the original request document retList[0]: $error
debug: Ending pflow, subthreads=1
Output documents:
End Object Name:trace_FLOWCHART_STARTUP_START_Start#1  Document ID:2009-01-13T17_46_25.385Z_019.dat
End Object Name:trace_FLOWCHART_AGENT_Setup SciFiBooks DeleteAll#1  Document ID:2009-01-13T17_46_25.385Z_020.dat
End Object Name:trace_FLOWCHART_ADAPTER_Run SciFiBooks DeleteAll#1  Document ID:2009-01-13T17_46_25.385Z_021.dat
End Object Name:trace_FLOWCHART_STARTUP_SET_Signal DeleteAll Finished#1  Document ID:2009-01-13T17_46_25.385Z_022.dat
End Object Name:trace_FLOWCHART_STARTUP_END_End#1  Document ID:2009-01-13T17_46_25.400Z_023.dat
End Object Name:End  Document ID:2009-01-13T17_46_25.400Z_024.dat
End Object Name:trace_FLOWCHART_STARTUP_SYNCH_Waitfor DeleteAll Signal#1  Document ID:2009-01-13T17_46_25.400Z_025.dat
End Object Name:trace_FLOWCHART_AGENT_Get RSS Document from url that is specified in the original request document#1  Document ID:2009-01-13T17_46_25.400Z_026.dat
End Object Name:FAILED  Document ID:2009-01-13T17_46_25.400Z_027.dat
Total Output Documents :9
Total Execution Time :266 ms
Status: Succeeded