An active report provides customizable options for creating an HTML-formatted report that enables users to experience features similar to those found in Excel workbooks. An active report is designed for distribution to users to perform offline analysis and interactive functions without any connection to a server. All of the data and JavaScript code are stored within the HTML file, which also makes the output highly compressible for e-mail and transparent to security systems.
Specific FOCUS StyleSheet commands enable developers to set the initial state of the report and control the options available to users. When you develop active reports, the options that you can control include:
To create an HTML active report, use
ON TABLE {HOLD|SAVE} FORMAT AHTML
where:
Saves the report output to a temporary file for later use.
Saves the report output to a file for later use.
Creates an HTML version of the report.
The following code generates an HTML active report.
All customized (non-default) values and corresponding keywords, used to specifically format an HTML active report, are shown in bold.
TABLE FILE CENTURYSALES SUM ORDERNUMBER ORDERDATE QUANTITY LINEPRICE BY PLANTCODE AS 'Plant' ON TABLE SET PAGE-NUM OFF ON TABLE SET BYDISPLAY ON ON TABLE NOTOTAL ON TABLE HOLD FORMAT AHTML ON TABLE SET STYLE * UNITS=IN, SQUEEZE=ON, ORIENTATION=PORTRAIT, $
TYPE=REPORT, GRAPHCOLOR='GREEN', GRAPHCOLORNEG='RED', $
TYPE=REPORT, FONT='ARIAL', SIZE=9, COLOR='BLACK', BACKCOLOR='NONE', STYLE=NORMAL, FREEZE-WIDTH=AUTO, LINES-PER-PAGE=30, CALC-LOCATION=BOTTOM,$
TYPE=TITLE, STYLE=BOLD, $ TYPE=REPORT, OBJECT=MENU, COLOR=RGB(0 51 102), HOVER-COLOR='WHITE', BACKCOLOR=RGB(51 204 204), HOVER-BACKCOLOR='PURPLE', BORDER-COLOR='FUCHSIA', $
TYPE=REPORT, OBJECT=STATUS-AREA, COLOR=RGB(153 51 0), BACKCOLOR='AQUA', $
TYPE=REPORT, OBJECT=CURRENT-ROW, HOVER-BACKCOLOR=RGB(255 255 153), BACKCOLOR=RGB(255 153 0), $
TYPE=REPORT, OBJECT=CALC-AREA, COLOR=RGB(153 51 0), BACKCOLOR=RGB(255 204 153), $
TYPE=REPORT, COLUMN=N2, CALCULATION=CNT, $ TYPE=REPORT, COLUMN=N4, CALCULATION=SUM, $ ENDSTYLE END
The output is:
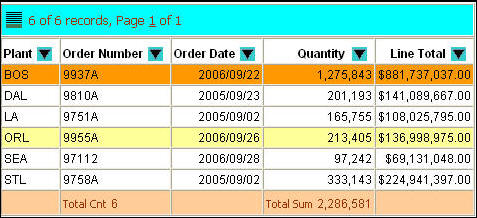
Starting at the top of the report, notice the customized background colors, the record status and page navigation bar, the first data row (which is selected), the fourth data row (which is hovered), and the calculation row at the bottom.
Some of the formatting options can only be controlled or implemented from the user menus in the output of an active report. For more information about these options, see User-Controlled Options in an Active Report.
You can set the initial state of an active report by customizing many report options with FOCUS StyleSheet syntax. You can enable or disable some options prior to distribution to users. The following syntax sections describe the options you can control.
To control how windows display in the report output when multiple windows are open in the Web browser, use
TYPE=REPORT, WINDOW-DISPLAY=coldesc, $
where:
Enables the report to display multiple open windows as tabs or cascaded windows in the Web browser. Multiple windows are created in the browser when viewing data as a chart, a roll-up table, and so on.
Valid values are CASCADE or TAB.
To control the colors of the row being selected or hovered over, use
TYPE=REPORT, OBJECT=CURRENT-ROW, HOVER-BACKCOLOR=hovercolor, BACKCOLOR=selectcolor, $
where:
Specifies the object, which is the current row where the mouse pointer is clicked, or is hovering.
Specifies the background color of the row where the mouse pointer is hovering. The default value is RGB(255 252 204), which is a shade of yellow. Valid values can be either a preset color name in single quotes, for example, 'YELLOW', or the RGB (red green blue) numeric values, for example, RGB(255 255 153).
Specifies the background color of the row selected (click anywhere within a row). The default is RGB(51 255 204), which is a mix of green and blue. Valid values can be either a preset color name in single quotes, for example, 'BLUE', or the RGB (red green blue) numeric values, for example, RGB(153 53 0).
To control the user menu options, which determine the location and color characteristics of the user menu in the report, use the appropriate syntax section that follows.
To control all of the colors of the user menu, use
TYPE=REPORT, OBJECT=MENU, COLOR=textcolor, HOVER-COLOR=hovertextcolor,BACKCOLOR=backcolor, HOVER-BACKCOLOR=hoverbackcolor,BORDER-COLOR=bordercolor, $
where:
Specifies the object, which is the user menu.
Specifies the color of the text (font) in the user menu. BLACK is the default value. Valid values can be either a preset color name in single quotes, for example, 'YELLOW', or the RGB (red green blue) numeric values, for example, RGB(153 153 153).
Specifies the color for the hover text in the user menu. BLACK is the default value. Valid values can be either a preset color name in single quotes, for example, 'RED', or the RGB (red green blue) numeric values, for example, RGB(255 255 153).
Specifies the color for the background (non-text) areas in the user menu. SILVER is the default value. Valid values can be either a preset color name in single quotes, for example, 'GOLD', or the RGB (red green blue) numeric values, for example, RGB(153 51 0).
Specifies the color for the background area of the user menu where your mouse pointer is hovering. WHITE is the default value. Valid values can be either a preset color name in single quotes, for example, 'ORANGE', or the RGB (red green blue) numeric values, for example, RGB(51 204 204).
You can use this, along with the hover text color, to visually contrast the menu option where the mouse is currently hovering from the rest of the menu.
Specifies the color for the borders of the user menu. WHITE is the default value. Valid values can be either a preset color name in single quotes, for example, 'BLUE', or the RGB (red green blue) numeric values, for example, RGB(255 255 153).
To control the calculations options, which determine the column and the calculation you want to perform, along with the styling characteristics of the calculation results row, use the appropriate syntax section that follows.
TYPE=REPORT, COLUMN=coldesc, CALCULATION=calc, $
where:
Specifies the description (column name or identifier) of the column where you want to perform a calculation.
Specifies the calculation to be performed. The default is no calculation.
For columns containing numeric data, select from: SUM, AVE, MIN, MAX, CNT, CNT.DST, PCT.TOT
PCT.TOT values appear in a separate column adjacent to the column for which it is calculated, and styling is inherited from the visualization column.
For columns containing text (alphanumeric) data, select from: CNT, CNT.DST
TYPE=REPORT, CALC-LOCATION={TOP|BOTTOM}, $
where:
Specifies the top row of the report as the location of the calculation results. TOP is the default value.
Specifies the bottom row of the report as the location of the calculation results.
TYPE=REPORT, OBJECT=CALC-AREA, COLOR=color, BACKCOLOR=backcolor, $
where:
Specifies the object, which is the calculation results row.
Specifies the color for the calculation values in the calculation results row. The default value is BLACK and is inherited from the column title font color. Valid values can be either a preset color name in single quotes, for example, 'RED', or the RGB (red green blue) numeric values, for example, RGB(255 255 153).
Specifies the color for the background in the calculation results row. The default value is WHITE and is inherited from the column title background color. Valid values can be either a preset color name in single quotes, for example, 'GOLD', or the RGB (red green blue) numeric values, for example, RGB(153 51 0).
To control the colors of the graphic values used with the visualization option, use
TYPE=REPORT, GRAPHCOLOR=positivecolor, GRAPHCOLORNEG=negativecolor, $
where:
Specifies the color for the positive values displayed in the optional visualization column. BLACK is the default value. Valid values can be either a preset color name in single quotes, for example, 'BLUE', or the RGB (red green blue) numeric values, for example, RGB(255 255 153).
Specifies the color for the negative values displayed in the optional visualization column. BLACK is the default value. Valid values can be either a preset color name in single quotes, for example, 'VIOLET', or the RGB (red green blue) numeric values, for example, RGB(153 153 153).
To control the freeze column options, which determine the column (and all columns to the left) that will freeze when scrolling to the right to view other columns in the report output, use
TYPE=REPORT, FREEZE-COLUMN=coldesc, $
or
TYPE=REPORT, FREEZE-WIDTH=AUTO, $
where:
Specifies the description (column name or identifier) of the column you want to freeze. You can only specify one freeze column, which must be a BY sort field. The default value is none (no freeze column).
Enables the report to freeze at a particular column that will be automatically determined by FOCUS for optimal viewing.
If you can view the entire report output on the screen without scrolling, the freeze will not be applied.
To control the hide columns options, which determine the columns that will be hidden from view in the report output, repeat the following for each column you want to hide.
TYPE=REPORT, COLUMN=coldesc, HIDE={ON|OFF}, $
where:
Specifies the description (column name or identifier) of the column you want to hide. You can hide multiple columns, but you cannot hide all columns (at least one column must always be visible).
Enables the option.
Disables the option. OFF is the default value.
To display NOPRINT fields in the active report drop-down menu, use
TYPE=REPORT, ALLOW-NOPRINT={ON|OFF}, $
where:
Displays all NOPRINT fields in the active report menu.
Does not display NOPRINT fields in the active report menu. OFF is the default value.
Note: This setting does not affect fields hidden using HIDE=ON syntax. In order to simply hide the field, but make it available for later use in an active report drop-down menu, use HIDE=ON syntax instead.
To control active report menu options available to the users, use
TYPE=REPORT, ALLOW-feature={ON|OFF}, $
where:
Specifies the feature. Select from:
PAGINATION to enable the use of show records options.
FILTER to enable the use of filtering or highlighting options.
FREEZE to enable the use of freeze column options.
CALC to enable the use of calculation options.
HIDE to enable the use of hide columns options.
CHART to enable the use of chart creating options.
EXPORT to enable the use of exporting options.
VISUALIZE to enable the use of graphical visualization options.
SORT to enable the use of sorting options.
ROLLUP to enable the use of roll-up table options.
PIVOT to enable the use of pivot table options.
COMMENTS to enable the use of comment options.
WINDOW to enable the use of window type options.
RESTORE to enable the use of restore options.
SENDEMAIL to enable the use of send as e-mail options.
SAVECHANGE to enable the use of save changes options.
PRINT to enable the use of print options.
TOOLS to enable the use Chart/Rollup Tool, Pivot Tool, and Grid Tool options.
Enables the option. ON is the default value for all user-controlled options.
Disables the option.
In this section: |
For active reports, you can:
1-25 records, Page 1 of 4
You can display the range of records that appear on a page by creating a JavaScript file that overwrites the default display. For details, see Displaying the Range of Records on a Page.
How to: |
This topic describes the syntax for determining the number of rows displayed per page and the styling characteristics of the record status and page navigation bar.
Use the appropriate syntax section that follows.
TYPE=REPORT, LINES-PER-PAGE={n|UNLIMITED},$
where:
Specifies the number of rows displayed on each HTML page. The default value is 20 rows when the LINES-PER-PAGE option is used. Otherwise, the server default value is 57 rows.
Specifies that you want to show all the results on one HTML page.
TYPE=REPORT, OBJECT=STATUS-AREA,PAGE-LOCATION={TOP|BOTTOM},JUSTIFY={LEFT|CENTER|RIGHT}, COLOR=textcolor, BACKCOLOR=backcolor,$
where:
Specifies the object, which is the record status and page navigation bar.
The record status and page navigation bar show row and page information, where your cursor is positioned, relative to the total number of rows and pages in the report (for example, 10 of 100 records (10.00%), Page 1 of 3).
Specifies the location of the record status and page navigation bar, which is either at the top of the report above the report header, or at the bottom of the report below the report footer. TOP is the default value.
Specifies whether you want the information in the record status and page navigation bar to be centered, left-justified, or right-justified. CENTER is the default value.
Specifies the text color for the record status and page navigation bar. BLACK is the default value. Valid values can be either a preset color name in single quotes, for example, 'GREEN', or the RGB (red green blue) numeric values, for example, RGB(153 153 153).
Specifies the background color for the record status and page navigation bar. SILVER is the default value. Valid values can be either a preset color name in single quotes, for example, 'WHITE', or the RGB (red green blue) numeric values, for example, RGB(51 153 102).
How to: |
By default, the strings and parameters used to display the pagination bar are stored in the IRPSTR member of the data set allocated to DDNAME JS.
'paglinetext':"<%^%rcs of %trcs records, Page %inds of %pgs%> <span id='smsg%tn'><\/span>"
'paglinetext':"<%^%frcs-%lrcs records, Page %inds of %pgs%> <span id='smsg%tn'><\/span>"
The pagination bar is displayed as follows. By default, 20 records are displayed on each page. As a result, the customized pagination bar displays a range of 1-20 records on the first page.
TYPE=REPORT,LINES-PER-PAGE=n,$
where:
Is the number of lines per page to display.
TYPE=REPORT,OBJECT=STATUS-AREA, JUSTIFY=just, PAGE-LOCATION=location, COLOR=textcolor, BACKCOLOR=backcolor,
where:
Is the justification for the text in the pagination bar. Valid values are LEFT, CENTER, or RIGHT. CENTER is the default value.
Is the location of the pagination bar. Valid values are TOP or BOTTOM. TOP is the default value.
Specifies the text color, either a color name enclosed in single quotation marks, or a color code in the form RGB(r,g,b). The default value is BLACK.
Specifies the background color, either a color name enclosed in single quotation marks, or a color code in the form RGB(r,g,b). The default value is SILVER.
For example, use the following StyleSheet declaration and run the report:
TYPE=REPORT, LINES-PER-PAGE=10, OBJECT=STATUS-AREA, JUSTIFY=LEFT, PAGE-LOCATION=BOTTOM,$
The pagination bar now displays 10 records per page, as shown in the following image. Based on the styling characteristics supplied in the request, the pagination bar appears at the bottom of the page, and the text inside the pagination bar is left-justified.
Tip: You can also specify the number of records to display per page when a report is run. Click Show Records from a drop-down menu on the report. In the following image, 5 Records per page is selected.
You can suppress the display of the pagination bar using FOCUS StyleSheet code.
ON TABLE SET STYLE * TYPE=REPORT, OBJECT=STATUS-AREA, PAGE-LOCATION=OFF, $ ENDSTYLE
Once you suppress the display of the pagination bar, you can no longer navigate to a page after the first page if the number of records in the report exceeds the records (lines) per page that you set.
The following options can be implemented only from the user menus in the output of an active report. Basic information for each of these options provides a more comprehensive understanding of this type of report.
If the ALLOW-SORT option is enabled, you can sort columns in either ascending or descending order. For string data types, the sorting is alphabetical. For date data types, the sorting is chronological. Only single column sorts are supported.
If the ALLOW-VISUALIZE option is enabled, you can display visualization graphics in a new column inserted into the report to the right of the selected column. Negative values appear with colored bars that extend to the left of center, and positive values appear with colored bars that extend to the right of center.
If the ALLOW-CHART option is enabled, you can create charts using roll-up tables. All applied filters are respected, and all calculation methods are available to create aggregation charts. A selected BY sort field and a measure column are required. There is also an option to open charts in separate browser windows.
If the ALLOW-EXPORT option is enabled, you can export all data, or filtered data only. The export method only exports data, not the JavaScript code, which makes exported reports static without the interactive options available in an active report. The export formats supported are: Save as HTML (formatting is preserved), XML export to Excel (formatting is not preserved), and Save as CSV (formatting is not preserved).
If the ALLOW-FILTER option is enabled, you can filter or highlight data. Filtering limits the output to display only data that meets the criteria in the WHERE clause specified with the user menus. Highlighting changes the color of the data in the output based on the criteria in the WHERE clause specified with the user menus.
When multiple active reports are inserted in the same HTML page, you can apply filters on all reports containing a common BY sort field.
The AREXPIRE parameter enables you to set the date when an active report expires and the report output can no longer be displayed.
The syntax is
SET AREXPIRE = {yymmdd|xxxDAYS}
where:
Is the expiration date in the format of year, month, and day. For example, if you want the report to expire on January 1, 2009, use 090101.
Is the number of days from the current date that the report expires. Valid values are 1 to 999.
The command can also be issued from within a request using:
ON TABLE SET AREXPIRE {yymmdd|xxxDAYS}
The ARPASSWORD parameter enables you to set a password that is required to view active report output. Prior to opening the report output, the user is prompted to enter a password to unlock the report.
The syntax is
SET ARPASSWORD = password
where:
Is any character string up to 32 characters in length.
The command can also be issued from within a request using:
ON TABLE SET ARPASSWORD password
The following is a list of commands and features that are not supported for HTML active reports:
|
Information Builders |