FOCLOG Reporting

In this section:

FOCLOG comes packaged with a Master File that gives FOCUS access to the log file. It also comes with a menu driven interface with usage reports that you can start running as soon as you decide you have collected enough usage data.

Using the Menu-Driven FOCLOG Reporting Interface

How to:

Reference:

The menu-driven FOCLOG reporting interface provides a review of usage patterns and detailed analysis of the FOCLOG file. Overlap between the summary and detailed report contents support easy analysis of the usage data. Run-time options enable easy adjustment of the collection and aggregation periods and sort criteria to aid in analyzing apparent anomalies.

The reports are organized into dimensions that group similar types of reports and concepts of analysis.

Reference: Specifying Values Used in Report Generation

Before running the reporting interface, you must edit the FLPROF FOCEXEC file to specify the company name you want to display in the report headings and to allocate your FOCLOG log file.

The following is a listing of the FLPROF FOCEXEC:

-************************************************************************
-*
-* INFORMATION BUILDERS INC.
-* FOCLOG STATISTICAL REPORTS
-*
-* PROFILE FOR FOCLOG REPORTING
-*                                                       @MFSM_NOPROLOG@
-************************************************************************
 
 
-* * * * * * * * * * * * * * * * * * * * * * * * * * * * * * * * *
-* PUT YOUR COMPANY NAME HERE AS IT SHOULD APPEAR ON ALL REPORTS.
-SET &&COMPANY  = 'INFORMATION BUILDERS INC.';
-*
-IF &FOCMODE EQ 'TSO' OR 'MVS' GOTO MVS_ALLOC ;
-*                   VM/CMS USERS
-* CHANGE THE FOLLOWING LINE TO REFLECT THE SFS DIRECTORY NAME
-*        YOU CHOSE FOR YOUR FOCLOG FILE.
CMS FILEDEF FOCLOG DISK VMSYSU:FOCLOG.DATA
-GOTO CONT
-MVS_ALLOC
-*                  MVS/TSO USERS
-* CHANGE THE FOLLOWING LINE TO REFLECT THE DATASET NAME
-*        YOU CHOSE FOR YOUR FOCLOG FILE.
DYNAM ALLOC FILE FOCLOG DA FLHLQ.FOCLOG.DATA SHR REUSE
-RUN
-CONT
-* * * * * * * * * * * * * * * * * * * * * * * * * * * * * * * * *

Make the following changes:

  • Replace 'INFORMATION BUILDERS, INC.' with your company name in the following line:
    -SET &&COMPANY  = 'INFORMATION BUILDERS INC.';
  • Replace FLHLQ.FOCLOG.DATA with the fully qualified name of your FOCLOG log file in the following line:
    DYNAM ALLOC FILE FOCLOG DA FLHLQ.FOCLOG.DATA SHR REUSE

Save the edited version of FLPROF FOCEXEC before running the reports.

Procedure: How to Invoke the FOCLOG Reporting Interface

From FOCUS, issue the following command to display the report selection menu:

EX FLMENU
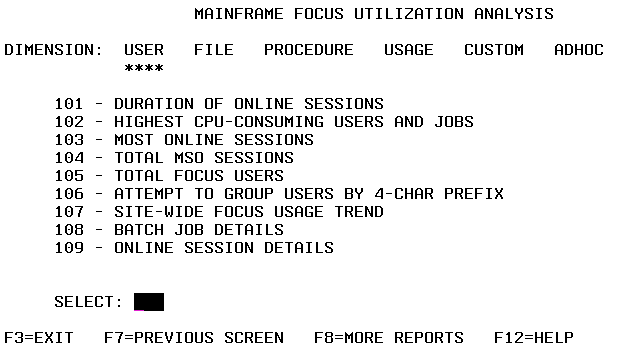
Use the PF8 and PF7 keys to move forward and backward through the report selection menus for the following five reporting dimensions listed at the top of the screen:

  • USER. These reports describe user-oriented activity on the system.
  • FILE. These reports describe files accessed by FOCUS.
  • PROCEDURE. These reports describe FOCUS programs running on the system.
  • USAGE. These reports describe FOCUS activity.
  • CUSTOM. These reports are provided by the user. For information on creating your own reports and adding them to the reporting interface, see How to Build and Catalog a Custom FOCLOG Report.

To select a specific report, enter its three-digit report number. If you know a report's three-digit number, you can enter that number from any screen.

Tip: If you are on a screen and want to run a report listed on that screen, you can enter the one or two-digit number to the right of the leftmost digit (which is the screen number). For example, if you are on screen 1, you can run report 109 by entering 9 or 09.

If you want to enter FOCUS from the interface in order to run your own requests against the FOCLOG file, select the ADHOC dimension.

Use the function keys as described at the bottom of each screen. Look for helpful messages that appear below the function key line.

Once you have selected a report, an options screen displays:
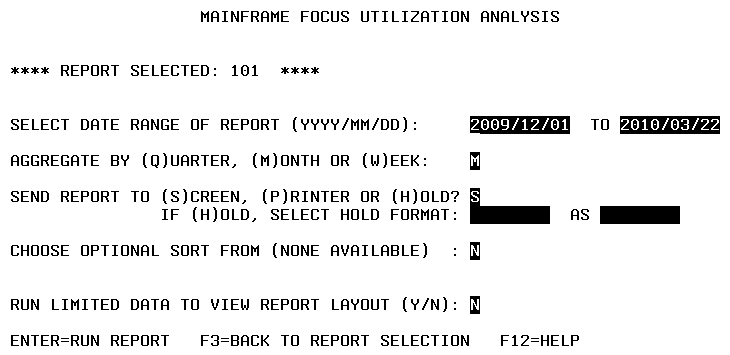
You can specify the following options on this screen:

  • The date range covered. Supply the dates in YYYY/MM/DD format, using the default values as a guide. The default is a three-month range from the current date backwards.
  • The aggregation period (Quarter, Month, Week). This applies to reports that have a calendar sort level and can accommodate the selection.
  • The report destination (Screen, Print, HOLD file). Enter:

    S to see the report on your screen.

    P to send the report to your printer.

    H to store the report results in a HOLD file. By default, the format type will be a BINARY HOLD file. You can specify a different format and an AS phrase to supply a name other than the default name HOLD.

  • Sort options, if any are available for that report. The first sort is generally the time period. Some reports can be additionally sorted on other columns, such as duration, CPU, EXCP, records, and lines. Only the sorts applicable to that report are shown. If none are available, NONE AVAILABLE displays. Use the first letter of the word to select that sort column, or if you do not want an additional sort level, either leave it blank or enter N (None).
  • The option of making a limited request to review report layout. Enter Y at this prompt to see a version of the report with limited data. A report may not display at all if no data matches the criteria for selecting the limited records.

The date period you select for the first request in a session remains in effect until you change it, which you can do on any report selection screen. This is also true for aggregation periods and report destinations.

Example: Running a FOCLOG Report

The following example runs FOCLOG report FLRPT301.

First, make sure you have access to the FOCLOG log file and that you added the appropriate DYNAM command in the FLPROF FOCEXEC file.

Then, issue the following command to execute the reporting interface:

ex flmenu

The following screen displays:

Press F8 twice to open the PROCEDURE screen:
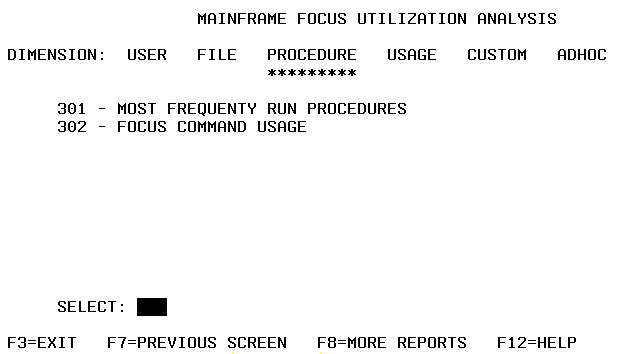
Enter the number 301 in the SELECT field to run FLRPT301. The Options screen opens:
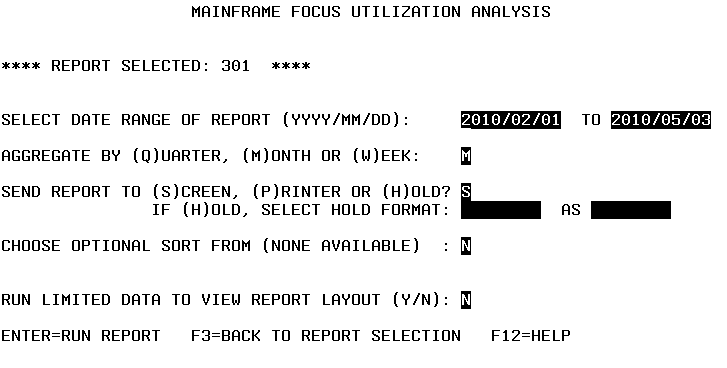
Accept the default options and run the report by pressing Enter. A report similar to the following displays:
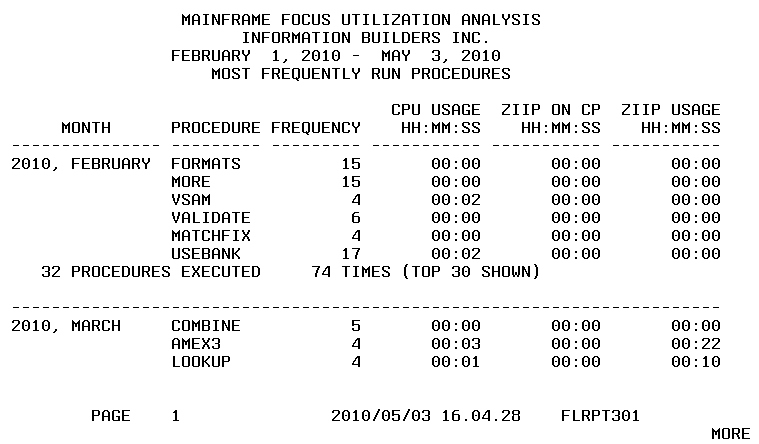
Press Enter to scroll through subsequent pages of the report. At the last page of the report, press Enter to return to the menu screen.

Procedure: How to Build and Catalog a Custom FOCLOG Report

  1. Write and debug a FOCEXEC that reports against the FOCLOG file. The author is responsible for code and results.
  2. Store the FOCEXEC with a name of the following form:
    FLRPT5nn

    where:

    nn

    Is the next available two-digit number on the CUSTOM screen. For example, the ninth custom report should be named FLRPT509. The screen supports up to 10 reports.

  3. Have your FOCLOG Administrator edit the FLMENU FOCEXEC to:
    1. Adjust the CRTFORM of the CUSTOM screen with the name of your report at the proper number.
    2. Then, after the following line, change the associated 9xx to 5xx:
      '-* REPORT NUMBER VALIDATION'

If you need any SET commands in your FOCEXEC, reset them at the end of your routine. To do that, first capture the current setting with the following command:

? SET setname &HOLDIT

Then restore it at the end of the routine with:

SET setname=&HOLDIT

Report Layouts

The packaged reports all have standard four-line headings:

MAINFRAME FOCUS UTILIZATION ANALYSIS
COMPANY NAME
DATES COVERED (FROM - TO)
FOCLOG REPORT NAME (generated by your selection)

Report footings contain the page number, the date and time the report was requested and the internal name of the report corresponding to its number on the selection screen.

Report Contents

Each report examines an aspect of FOCUS usage at your site. There is considerable overlap among reports, as some present high-level usage summaries while others provide underlying details, potentially generating tens or even hundreds of pages.

Use the detail level reports to examine suspicious or irregular value clues on the summary reports.

Sort Options

Columns are sorted consistently across reports. Date periods are sorted in ascending chronological order, names are sorted alphabetically, and numeric columns are typically sorted high to low where the numbers of most interest tend to be the higher ones.

When optional sorts are invoked, the notation "* * SORT* *" appears at the top of the sort column indicating its selection by the user as opposed to a default.

Report Descriptions

Reference:

Each of the following tables describes the reports available for a specific dimension. Each report has an internal name of the form:

FLRPTnnn

where:

nnn

Is the three-digit report number on the menu screen.

Reference: User Reports - 100 Series

The 100 Series reports show user activities and the resources consumed, permitting examination of usage by individuals, groups, usage types (online vs. batch), or a site-wide trend analysis.

No.

Report Title and Contents

Interpreting Report Output

101

Duration of Online Sessions summarizes the length of time users were logged on in predefined ranges of hours (<1, 1-4, 4-8, 8-12, >12).

Only ranges with contents are displayed.

  • The <1 hour group is usually ignored.
  • 1-4 hours is effectively a morning or afternoon session, realizing that many users log off at lunch time, which creates two 1-4 hour sessions.
  • 4-8 hours is a normal work day.
  • 8-12 hours may show a dedicated worker.
  • >12 hours may be a terminal left on overnight.

Look for the >12 hours category, which often indicates IDs left on overnight, exorbitant usage, or a process running on an unattended ID. Many other reports show the breakdown of Duration to further investigate these situations. For example, sort report 109 by Duration to see who was logged on for the various periods.

102

Highest CPU-Consuming Users and Jobs identifies users running procedures that absorbed the most CPU and zIIP usage during the period. The report is sorted by CPU usage for Batch jobs and Online sessions.

High CPU and zIIP usage (particularly for online sessions) may indicate abuse or, more likely, users whose needs should be evaluated for possible efficiency improvement.

103

Most Online Sessions summarizes usage trends over the period by number of sessions (grouped by tens) and most frequent users in each.

Spikes identify heavy usage periods, such as end-of-month, quarter, or year, or special promotions or events.

Upward trends by period may indicate other symptoms. Run Report 108 or 109 to see details of a specific user's activity in the higher categories.

104

Total MSO Sessions shows, by period, what part of FOCUS online usage is performed using MSO (for sites running MSO).

A significant percentage generally indicates a company's efficient use of shared resources provided by MSO.

105

Total FOCUS Users rolls up overall FOCUS usage across the site for each period. The Active Users and Total Jobs columns imply average usage per user, and the CPU and zIIP columns track the actual FOCUS processing performed during the period.

Look for spikes (positive or negative) and progressive trends in the numbers. Many other reports break down these summarized numbers.

106

Attempt to Group Users by 4-Char Prefix assumes that the first four characters of the user ID roughly corresponds to definable groups in an organization. If that assumption is true for your company, this report may be of value. The report shows the number of users with that prefix and the CPU and zIIP used by that group. Re-sorting by CPU could point to the largest group of FOCUS users on the site.

Assuming the first four user ID characters are significant workgroup differentiators, this report can be useful for comparing relative usage loads.

Alternatively, see Information Captured in the FOCLOG File for a description of the FOCLOG Master File in order to develop your own schemes for collapsing user IDs into local groups.

107

Site-Wide FOCUS Usage Trend summarizes site-wide FOCUS usage for each period, broken out by batch and online usage and by Reports (extracts) versus Updates (data changes).

Look for significant usage spikes in CPU and zIIP or number of runs, and possible imbalances between reports and update operations.

108

Batch Job Details describes every batch job during the period, showing the timestamp, who ran it, the LPAR FOCUS used, the job duration, and CPU and zIIP utilized.

This report could be hundreds or thousands of pages long.

Sort by Duration or CPU to review largest jobs first.

109

Online Session Details describes every online session run during the period, showing its start time, who logged on, the LPAR FOCUS used, job duration, CPU, and zIIP utilized.

This report could be hundreds or thousands of pages long.

Sort by Duration or CPU to see the most CPU-intensive sessions first. Similar to FLRPT108 for batch usage.

Reference: File Dimension Reports - 200 Series

The 200 Series reports identify key files and show when and how they were used.

No.

Report Title and Contents

Interpreting Report Output

201

Possible Extract Files Being Used identifies the largest flat files being used. Flat files are non-keyed sequential files rather than structured databases. They are typically created by other applications or by extracts from local databases. Extract files are often CPU savers in that they require fewer resources than repeatedly retrieving data from the main file. Not all files on this report are 'extract' files; the report only knows that they are SUFFIX=FIX files, so some knowledge of the origin and use of the files are critical to the evaluation.

Low use of extract files should be investigated for potential removal or merging. Even high usage could point to the need to evaluate a better way to supply that data. Extract files often unknowingly grow excessively large over time, so a point of re-evaluation may be warranted.

202

Files Originating Large HOLD File Extracts shows databases from which large extracts are generated. Frequent creation may point to the need to evaluate the creation strategy.

Confirm acceptability of large HOLD files.

203

Files Used by Users shows the files accessed during the period by each user. Sort the report by Records, Lines, or CPU to see the most used files.

Use to investigate a user ID whose activity was highlighted on another report.

204

Batch and Online File Usage shows relative FOCUS online and batch usage by file type.

This report concentrates on the type of file rather than the file name itself.

Usage at both ends of the spectrum may be of interest, depending on site conditions.

Re-sort by Duration, CPU, or EXCP to review impact by category.

205

Reports and Transactions Against Data Sources details usage of specific data sources during each period. Sorted by period and file name.

Note the effect of file types on statistical columns. Scroll right to view the Batch Updates column, which, along with the Batch Reports column, indicates the number of times the file was accessed during the period.

Re-sort by Duration, CPU, or EXCP to review most used files by those categories.

206

Files Using the Most CPU on Reports rolls up file usage across the entire period. Sorted by file name, you may re-sort by CPU, Records, or Lines to observe the most used files. Use FLRPT205 to break down the file usage by smaller periods.

The Rollup shows the degree to which the data extracted was aggregated on the report versus printed row by row as raw data. This implies output volume and how that file is being used. The higher the Rollup, the better.

207

Data Source Types Accessed by FOCUS summarizes FOCUS use by file type.

Run Report FLRPT206 to assess usage by individual file.

208

Most Records Extracted During Online Sessions summarizes users who extracted very large volumes of data on a regular basis, grouping record extracts in 100,000 record increments. It shows number of occurrences per group.

High numbers of occurrences might warrant a review of usage or indicate the need for a better way to access the data regularly.

Reference: Procedure Dimension Reports - 300 Series

No.

Report Title and Contents

Interpreting Report Output

301

Most Frequently Run Procedures lists the 30 most frequently executed procedures and their corresponding CPU and zIIP usage sorted by frequency. You can re-sort by CPU to see the largest running procedures.

Run FLRPT303 to list all procedures run during the period and review full usage details.

Frequently run procedures can generally be construed to be clearly valuable to the company. As such, you may want to get the most out of your investment by examining such procedures for efficiency, particularly if the CPU or CPU plus zIIP is high.

302

FOCUS Command Usage presents a broad summary of FOCUS usage across your site.

Typically, TABLE, that is, data extracts into reports or extract files will be the most used command. MODIFY indicates loads of, or transactions against, data files. Other major FOCUS functions are shown if they are used.

Re-sort by Duration, CPU, or EXCP to identify the most used commands by category.

303

Procedure Run Details lists every procedure run during the period showing the frequency, duration, CPU, zIIP, and EXCP demands (and relative percent of each) within the period.

Re-sort by Duration, CPU, or EXCP to identify the most resource-intensive or widely-used procedures.

Run FLRPT301 for a summary of the top 30 procedures.

304

Candidate Procedures for Pooled Tables Adaptation uncovers file usage patterns that appear to lend themselves to pooling, which could provide substantial CPU and zIIP savings.

This report has the potential of identifying procedures that can experience large CPU and zIIP savings for relatively little investment.

Pooled Tables performs a single read of a data source for any number of consecutive reports against that source, delivering huge savings in I/O, and in CPU, zIIP, and elapsed times.

Information Builders can help you evaluate the viability of pooling procedures listed on this report. Contact your local Information Builders representative for details about Pooled Tables.

Reference: Usage Dimension Reports - 400 Series

No.

Report name and contents

Interpreting Report Output

401

All LPARS Running FOCUS summarizes FOCUS usage/per period in each LPAR where FOCUS activity was recorded.

This is the only report of FOCUS activity by LPAR. You can re-sort the results by Duration or CPU.

402

Output Formats Used by Reports summarizes report destinations used during the period, revealing numbers of records extracted and lines output and the degree of aggregation (compression of application output).

Many reports go directly to the user's screen or are sent to FOCUS HOLD or SAVE files (the General category), and some are sent to other output formats available from FOCUS, listed below that. Only those formats used are listed. Re-sort by Records, Lines, or CPU to see the most common or intensive destination for FOCUS output.

High aggregation ratios show data is being aggregated into more readily interpretable information.

A low ratio for SCREEN implies that the raw data is displayed potentially hundreds of screens deep, which is invariably impenetrable and should be re-evaluated for usability.

Non-FOCUS output formats imply FOCUS is supplying data for third-party databases and analytical tools, such as Excel or PDF.

403

Daily User Activity Detail shows daily activity for every online session for every user during the period.

Caution: This report could easily run hundreds or thousands of pages.

This report provides the detail behind FLRPT102, Highest CPU and zIIP-Consuming Users and Jobs.

Look for repeated excessive expenses, which may in fact be perfectly valid high product usage.

Re-sort by Records, Lines, Duration, or CPU to look for highest usage or minimal usage.

404

Trend of Daily FOCUS Sessions (Report and Graph) bar graph summarizes the number of batch sessions per day.

Review usage trends and analyze spikes.

Days without sessions, including weekends, are not shown.

405

Hourly CPU Usage Accumulated (Graph) bar graph accumulates CPU and zIIP usage for each hour of the day, rolling together all days in the period. That is, a bar represents all of the usage accumulated on all days in the period for that particular hour. Hours are sorted from midnight to midnight; hours with no activity do not display. An hour shown represents the minutes in that hour, so '2am' represents 2am-3am.

Confirm the industry-typical trend of highest usage during workday hours and during peak times of overnight batch runs. Other spikes may be shift-related.

Restrict the date range to one day to examine CPU and zIIP usage on a particular day.

406

Possible Large Paper-Output Reports (100+ pages) details procedures generating large offline print files.

The report sorts the list by the largest reports in terms of approximate number of pages generated (assuming 40 lines of output per page, allowing for some typical lines of heading, footing, column heading, subfoots, blank lines, and so on). The report shows the procedure that ran the report and the (main) file against which the extract was done, as well as the number of times the report was so generated.

Confirm acceptable usage and number of runs.

The largest printed reports are the ones to investigate.

407

Daily Batch/Online CPU Utilization by Shift categorizes CPU and zIIP utilization by operating mode (online versus batch sessions) by approximate shifts (from 8AM to 6PM and from 6PM to 8AM) for each day in the report period.

A useful report for confirming performance is within normal bounds and if your CPU and zIIP usage is inline with industry trends.

408

Long-Running Sessions is an elapsed-time summary that rolls up all batch jobs and online sessions during the period, displaying the longest and average durations and number of runs within two ranges of hours (>2 and >7).

Average numbers from this report should be useful in evaluating the data on other reports.


Information Builders