series: [
{
   series: number,
      trendline: {
         enabled: boolean,
         mode: 'string',
                  equationLabel: {
            visible: boolean,
            font: 'string',
            color: 'string',
            mode: 'string'
         }
      }
}
]
where:
- series: number
Is a zero-based series number. If the series does not exist in the chart, the property is ignored.
- enabled: boolean
Enables or disables the trendline. Valid values are:
- true, which enables the trendline.
- false, which disables the trendline. This is the default value.
- mode: 'string'
Is string that defines the trendline mode (the type of equation used to generate the trendline). Valid values are:
- 'exponential'.
- 'geometric'.
- 'hyperbolic',
- 'linear'.
- 'logarithmic'.
- 'logQuadratic'.
- 'modExponential'.
- 'modHyperbolic'.
- 'polynomial'.
- 'quadratic'.
- 'rational'.
- undefined. This is the default value.
- equationLabel:
Defines the properties of the equation label for the trendline.
- visible: boolean
Controls the visibility of the equation label. Valid values are:
- true, which shows the equation label.
- false, which does not show the equation label. This is the default value.
- font: 'string'
Is a string that defines the size, style, and, typeface of the equation label. The default value is '8pt Sans-Serif'.
- color: 'string'
Is a color defined by a color name or numeric specification string. The default value is 'black'.
- mode: 'string'
Is a string that defines the equation label mode. Valid values are;
- 'equation' (displays the equation in the most appropriate form for the type of trendline generated. For a linear trendline, the equation is displayed in slope intercept form). This is the default value.
- 'r' (displays the correlation coefficient).
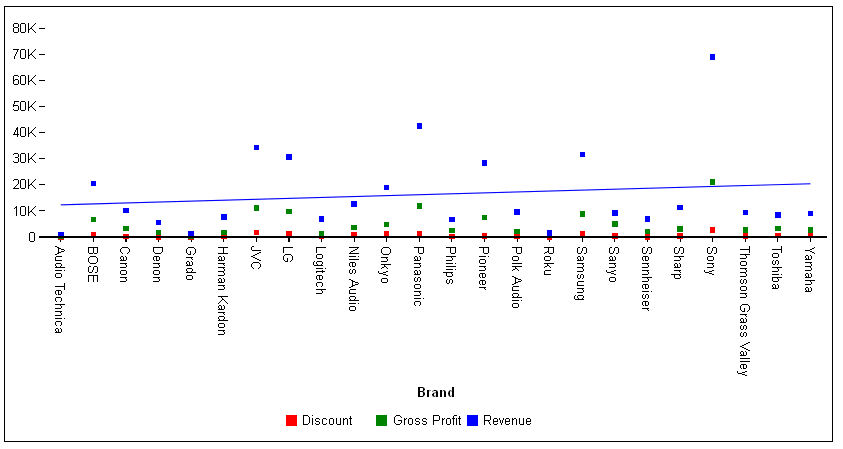
The following request generates a scatter chart with a linear trendline for series 2:
GRAPH FILE WFLITE
SUM DISCOUNT_US GROSS_PROFIT_US REVENUE_US
BY BRAND
ON GRAPH HOLD FORMAT JSCHART
ON GRAPH SET LOOKGRAPH SCATTERS
ON GRAPH SET STYLE *
*GRAPH_JS
series: [
    {series: 0, color: 'red'},
    {series: 1, color: 'green'},
    {series: 2,  color: 'blue', trendline: {enabled:true,mode: 'linear'}}
]
*END
ENDSTYLE
END
The output is:

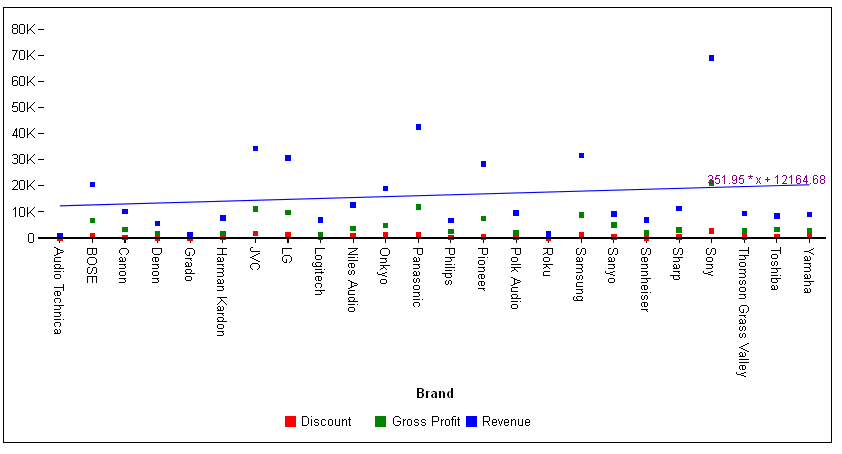
The following version of the request adds a purple equation label:
GRAPH FILE WFLITE
SUM DISCOUNT_US GROSS_PROFIT_US REVENUE_US
BY BRAND
ON GRAPH HOLD FORMAT JSCHART
ON GRAPH SET LOOKGRAPH SCATTERS
ON GRAPH SET STYLE *
*GRAPH_JS
series: [
    {series: 0, color: 'red'},
    {series: 1, color: 'green'},
    {series: 2,  color: 'blue',
       trendline: {
       enabled:true,
       mode: 'linear',
       equationLabel:{visible:true, color:'purple'}}}
]
*END
ENDSTYLE
END
The output is:
