series: [
{
   series: number,
   group: number, // Optional
   tooltip: ‘string’}
]
where:
- series: number
Is a zero-based series number, 'all' to assign the tooltip to all series, or 'reset' to remove default values. If the series does not exist in the chart, the property is ignored.
- group: number
Is an optional zero-based group number. If not specified, the property is applied to all groups in the series.
- tooltip: ‘string’
Is a string, or a function that returns a string, to display when the mouse hovers over the riser. If htmlTooltip is enabled, you can use the special string 'auto' to automatically populate the tooltip with series labels, group labels, and values. The content will be different for different chart types. See Generating HTML Tooltips (htmlToolTip) for examples.
A callback function is invoked with three arguments: value, series ID, and group ID. For example:
tooltip: function(value, series, group) {
 return this.title.text + ", value: " + value + ", s: " + series + ", g: " + group;
}
Note that single and double quotation marks are both supported to enclose text in the function definition.
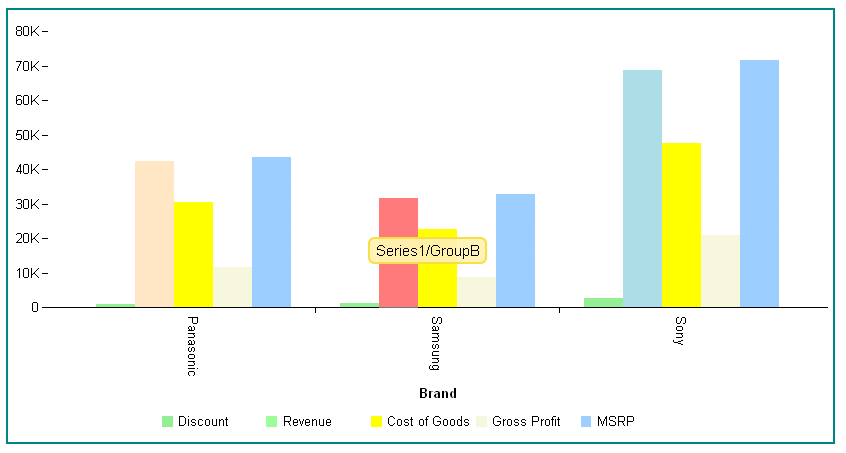
The following request assigns a tooltip to series 1, group 1:
GRAPH FILE WFLITE
SUM DISCOUNT_US REVENUE_US COGS_US GROSS_PROFIT_US MSRP_US
BY BRAND
WHERE BRAND EQ 'Sony' OR 'Samsung' OR 'Panasonic'
ON GRAPH HOLD FORMAT JSCHART
ON GRAPH SET LOOKGRAPH VBAR
ON GRAPH SET STYLE *
*GRAPH_JS
border: {width: 2, color: 'teal'},
series: [
   {series: 0, color: 'lightgreen'},
   {series: 1, group: 0, color: 'bisque'},
   {series: 1, group: 1, color: 'red', tooltip: 'Series1/GroupB'},
   {series: 1, group: 2, color: 'lightblue'},
   {series: 2, color: 'yellow'},
   {series: 3, color: 'beige'}
]
*END
ENDSTYLE
END
The tooltip displays when the mouse hovers over the specified riser:

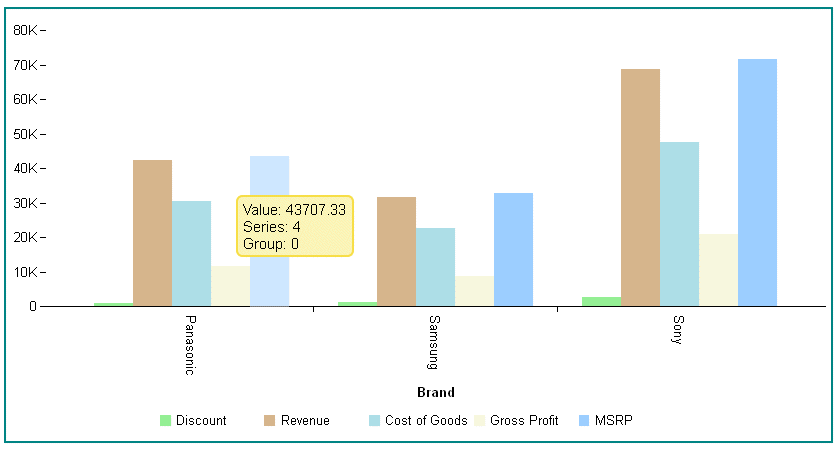
The following request uses a callback function to generate the tooltips. In order to remove all default tooltips so that the callback function will be used, you must use series 'reset' or set each individual series tooltip to undefined. HTML tags can also be used in the function. In this example, <br> tags are used to generate line breaks in the tooltips:
GRAPH FILE WFLITE
SUM DISCOUNT_US REVENUE_US COGS_US GROSS_PROFIT_US MSRP_US
BY BRAND
WHERE BRAND EQ 'Sony' OR 'Samsung' OR 'Panasonic'
ON GRAPH HOLD FORMAT JSCHART
ON GRAPH SET LOOKGRAPH VBAR
ON GRAPH SET STYLE *
*GRAPH_JS
border: {width: 2, color: 'teal'},
series: [
   {series: 'reset', tooltip: function(v, s, g) {return 'Value: ' + v
    +'<br>Series: ' + s +'<br>Group: ' + g;}},
   {series: 0, color: 'lightgreen'},
   {series: 1, color: 'tan'},
   {series: 2, color: 'lightblue'},
   {series: 3, color: 'beige'},
]
*END
ENDSTYLE
END
The output shows the custom tooltip returned by the callback function:

Note: When a tooltip is defined for one or all series, the htmlToolTip property can be used to define HTML-based (div) style tooltips for any chart tooltips. For information on HTML-based tooltips, see Generating HTML Tooltips (htmlToolTip).