axisname:
{
  colorBands: [
  {
    start: startval,
    stop: stopval,
    color: color  }
  ]
},
where:
- axisname
Can be:
- xaxis
- yaxis
- y2axis
- zaxis
- start: startval
Is a number or string that defines where on the axis to start the color band.
For a numeric axis:
- A number must be a value that is visible on the axis.
- A string must represent a percentage of the length of the axis. The string must be enclosed in single quotation marks and includes a percent symbol (for example, '50%').
For an ordinal axis:
- a number must be a value between 0 and 1 that represents a percentage of the length of the axis. (for example, .5 will start the color band in the center of the chart).
- A string must be a group label that is visible on the axis, enclosed in single quotation marks.
- stop: stopval
Is a number or string that defines where on the axis to end the color band.
For a numeric axis:
- A number must be a value that is visible on the axis.
- A string must represent a percentage of the length of the axis. The string must be enclosed in single quotation marks and includes a percent symbol (for example, '50%').
For an ordinal axis:
- a number must be a value between 0 and 1 that represents a percentage of the length of the axis. (for example, .5 will end the color band in the center of the chart).
- A string must be a group label that is visible on the axis, enclosed in single quotation marks.
- color: color
Defines the color of the band. Can be:
- A color defined by a color name or numeric specification string, or a gradient defined by a string.
- A JSON gradient definition.
For information about defining colors and gradients, see Colors and Gradients.
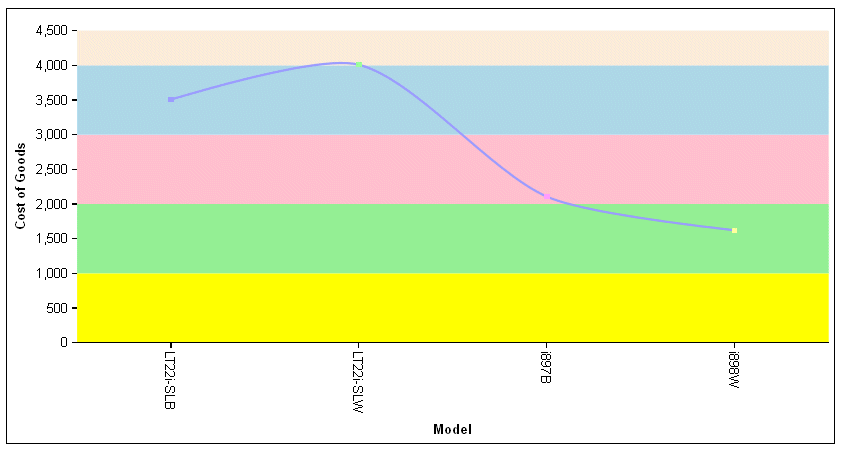
The following request defines color bands on the y-axis. Since the y-axis is numeric, the numbers in the color band definitions are values that appear on the y-axis:
GRAPH FILE WFLITE
SUM COGS_US
BY MODEL
WHERE PRODUCT_CATEGORY EQ 'Computers'
ON GRAPH HOLD FORMAT JSCHART
ON GRAPH SET LOOKGRAPH VLINE
ON GRAPH SET STYLE *
*GRAPH_JS
blaProperties: {lineConnection: 'curved'},
yaxis: {
  colorBands: [
    {start: 0,stop: 1000, color: 'yellow'},
    {start: 1000,stop: 2000,color: 'lightgreen'},
    {start: 2000,stop: 3000,color: 'pink'},
    {start: 3000,stop: 4000,color: 'lightblue'},
    {start: 4000,stop: 5000,color: 'antiquewhite'},
    {start: 5000,stop: 6000,color: 'limegreen'},
    ]
  }
*END
ENDSTYLE
END
The output is:

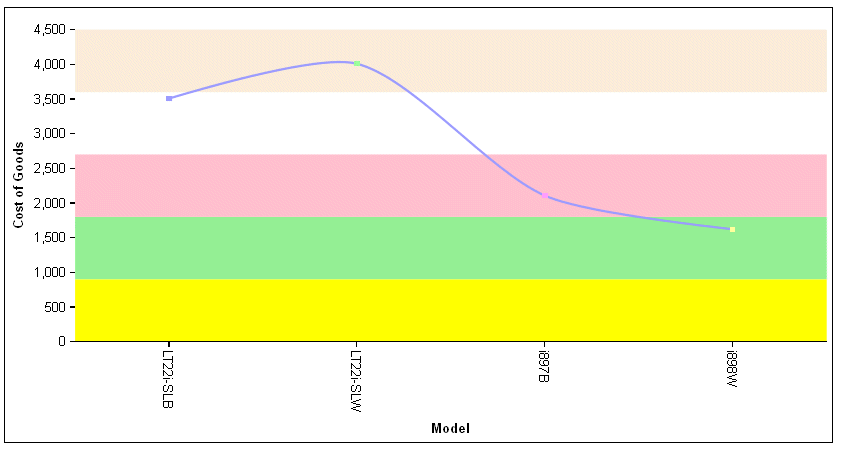
The following version of the colorBands object expresses the band start and stop properties as percentages:
yaxis: {
colorBands: [
    {start: 0,stop: '20%',color: 'yellow'},
    {start: '20%',stop: '40%',color: 'lightgreen'},
    {start: '40%',stop: '60%',color: 'pink'},
    {start: '60%',stop: '00%',color: 'lightblue'},
    {start: '80%',stop: '100%',color: 'antiquewhite'}
    ]
  }
The output is:

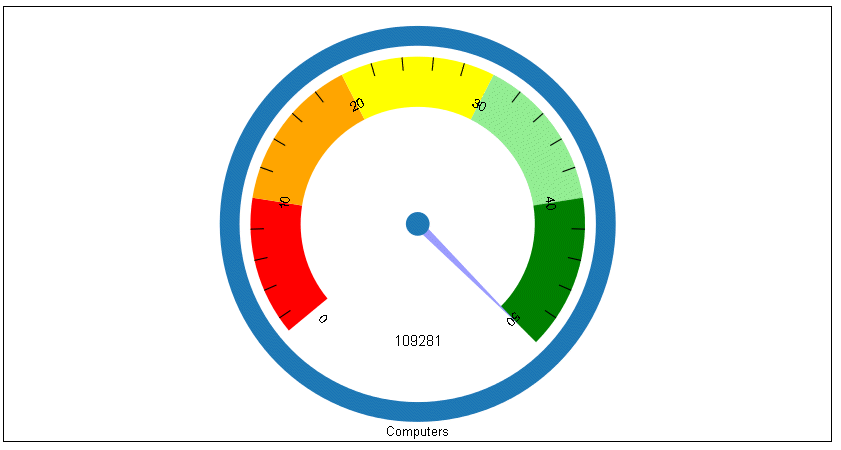
The following request generates a gauge chart and defines the color bands for the gauge axis:
GRAPH FILE WFLITE
SUM COGS_US
BY PRODUCT_CATEGORY
WHERE PRODUCT_CATEGORY EQ 'Computers'
ON GRAPH HOLD FORMAT JSCHART
ON GRAPH SET LOOKGRAPH GAUGE1
ON GRAPH SET STYLE *
*GRAPH_JS
yaxis: {
    min: 0,
    max: 50,
    colorBands: [
       {start: 1,stop: 10,color: 'red'},
       {start: 10,stop: 20,color: 'orange'},
       {start: 20,stop: 30,color: 'yellow'},
       {start: 30,stop: 40,color: 'lightgreen'},
       {start: 40,stop: 50,color: 'green'},
    ]
}
*END
ENDSTYLE
END
The output is:
