Syntax: How to Enable a Logarithmic Scale
axisname: {
  bIsLog: boolean  }
where:
- axisname
Specifies the numeric axis for the logarithmic scale. Valid values are:
- xaxis
- yaxis
- y2axis
- bIsLog: boolean
Can be:
- true, which enables a logarithmic scale on the numeric axis.
- false, which disables a logarithmic scale on the numeric axis. This is the default value.
Example: Enabling a Logarithmic Scale on a Numeric Axis
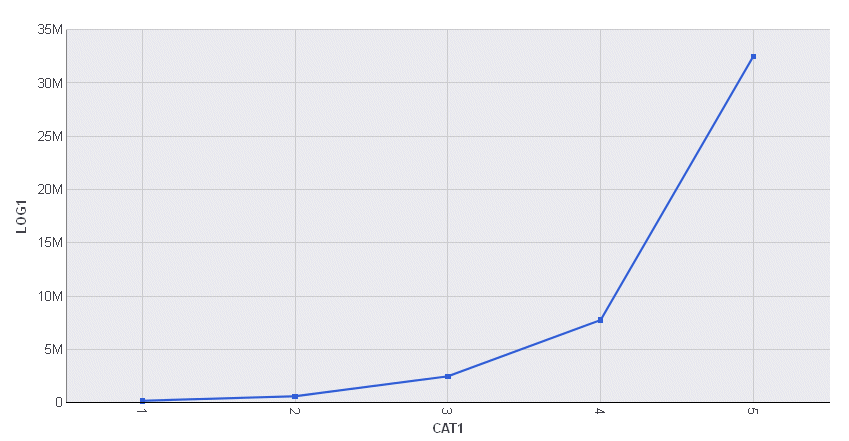
The following request against the WFLITE data source generates costs that differ by orders of magnitude, places them into categories based on these costs, and generates a line chart with a numeric y-axis that represents this new cost value:
DEFINE FILE WFLITE
LOG1= IF COGS_US GT 500 AND COGS_US LT 1000 THEN  COGS_US  *10
      ELSE IF COGS_US GE 1000 AND COGS_US LT 2000 THEN COGS_US  * 100
      ELSE IF COGS_US GE 2000 AND COGS_US LT 3000 THEN COGS_US  * 1000
      ELSE IF COGS_US GE 3000  AND COGS_US LT 3300 THEN COGS_US * 10000
      ELSE COGS_US ;
CAT1/I2= IF COGS_US GT 500 AND COGS_US LT 1000 THEN  2
      ELSE IF COGS_US GE 1000 AND COGS_US LT 2000 THEN 3
      ELSE IF COGS_US GE 2000 AND COGS_US LT 3000 THEN 4
      ELSE IF COGS_US GE 3000  AND COGS_US LT 3300 THEN 5
      ELSE 1 ;
END

GRAPH FILE WFLITE
SUM LOG1
BY CAT1
ON GRAPH HOLD FORMAT JSCHART
ON GRAPH SET LOOKGRAPH VLINE
ON GRAPH SET STYLE *
INCLUDE=ENDEFLT,$
ENDSTYLE
END
The output is:

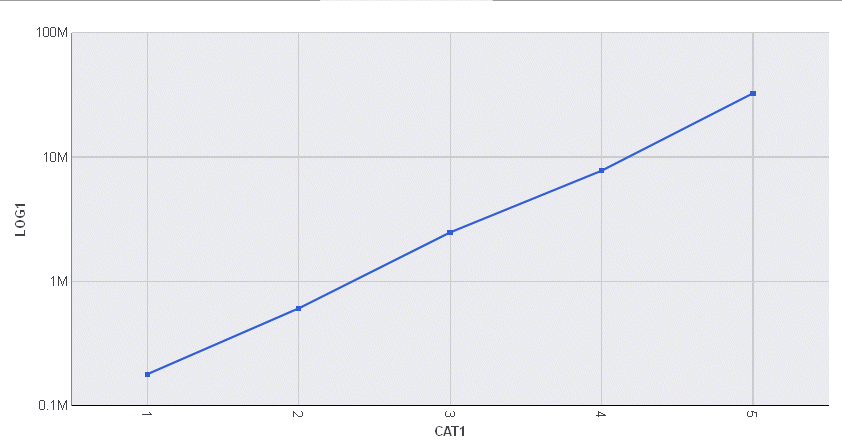
The following version of the request enables a logarithmic scale on the y-axis:
DEFINE FILE WFLITE
LOG1= IF COGS_US GT 500 AND COGS_US LT 1000 THEN  COGS_US  *10
      ELSE IF COGS_US GE 1000 AND COGS_US LT 2000 THEN COGS_US  * 100
      ELSE IF COGS_US GE 2000 AND COGS_US LT 3000 THEN COGS_US  * 1000
      ELSE IF COGS_US GE 3000  AND COGS_US LT 3300 THEN COGS_US * 10000
      ELSE COGS_US ;
CAT1/I2= IF COGS_US GT 500 AND COGS_US LT 1000 THEN  2
      ELSE IF COGS_US GE 1000 AND COGS_US LT 2000 THEN 3
      ELSE IF COGS_US GE 2000 AND COGS_US LT 3000 THEN 4
      ELSE IF COGS_US GE 3000  AND COGS_US LT 3300 THEN 5
      ELSE 1 ;
END

GRAPH FILE WFLITE
SUM LOG1
BY CAT1
ON GRAPH HOLD FORMAT JSCHART
ON GRAPH SET LOOKGRAPH VLINE
ON GRAPH SET STYLE *
*GRAPH_JS
yaxis: {bIsLog:true}
*END
INCLUDE=ENDEFLT,$
ENDSTYLE
END
On the generated chart output, the y-axis scale is logarithmic, making the rates of change between the categories easier to analyze:
