subtitle: {
   text: 'string',
   visible: boolean,
   align: 'string',
   font: 'string',
   color: 'string'
   }
where:
- text: 'string'
Is a string that defines the subtitle text. The default value is 'Chart Subtitle'.
- visible: boolean
Controls the visibility of the chart subtitle. Valid values are:
- true, which makes the chart subtitle visible.
- false, which makes the chart subtitle not visible. This is the default value.
- align: 'string'
Is a string that defines the alignment of the subtitle, Valid values are:
- 'center', which centers the subtitle in the draw area. This is the default value.
- 'chartFrame', which centers the subtitle aligned with the chart frame.
- 'left', which left-justifies the chart subtitle in the draw area.
- 'right', which right-justifies the chart subtitle in the draw area.
- font: 'string'
Is a string that defines the size, style, and, typeface of the chart subtitle. The default value is '10pt Sans-Serif'.
- color: 'string'
Is a string that defines the color of the chart subtitle using a color name or numeric specification string. The default value is 'black'.
For information about specifying colors, see Colors and Gradients.
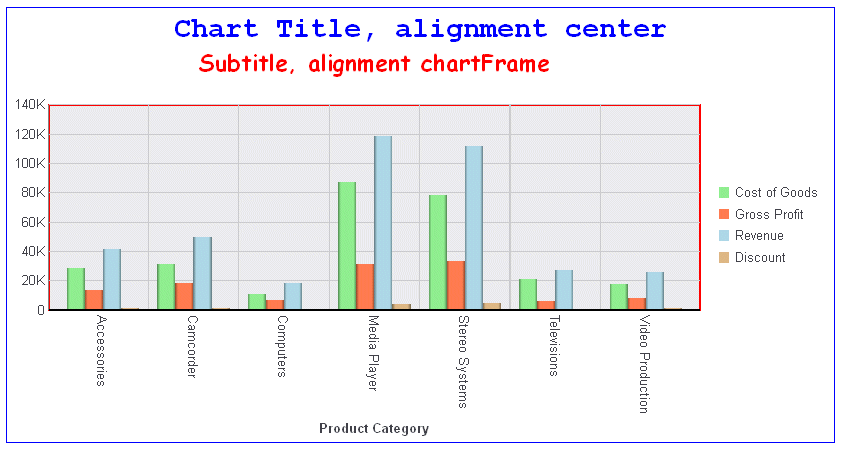
The following request generates a vertical bar chart with a subtitle. The alignment of the subtitle, and part of the text, depends on the Dialogue Manager variable named &SUBTALIGN, which is set to the value 'chartFrame':
-SET &SUBALIGN = 'chartFrame';
GRAPH FILE WFLITE
SUM COGS_US GROSS_PROFIT_US REVENUE_US DISCOUNT_US
ACROSS PRODUCT_CATEGORY
ON GRAPH HOLD FORMAT JSCHART
ON GRAPH SET LOOKGRAPH VBAR
ON GRAPH SET STYLE *
INCLUDE=ENDEFLT,$
*GRAPH_JS
border:{color:'blue'},
chartFrame: {border: {width:2, color:'red'}},
legend: {position:'right'},
 title: {
        text: 'Chart Title, alignment center',
        visible: true,
        font: 'Bold 20pt Courier',
        align: 'center',
        color: 'blue'},
 subtitle: {
     text: 'Subtitle, alignment &SUBALIGN',
     font: 'Bold 16pt Comic Sans MS',
     visible: true,
     align: '&SUBALIGN',
     color: 'red'
   },
series: [
    {series: 0, color: 'lightgreen'},
    {series: 1, color: 'coral'},
    {series: 2, color: 'lightblue'},
    {series: 3, color: 'burlywood'}
]
*END
ENDSTYLE
END
On the output, the title is centered in the draw area (align: 'center'), and the subtitle is centered aligned with the chart frame (align: 'chartFrame'):
