Syntax: How to Apply a Color or Gradient to the Draw Area
fill: {
        color: color}
where:
- color: color
Defines a fill color. Can be:
A string that defines a color by name or numeric specification string, or a gradient string. The default value is 'white'.
A JSON gradient definition object.
For information about specifying colors and gradients, see Colors and Gradients.
Example: Specifying a Fill Color or Gradient for the Draw Area
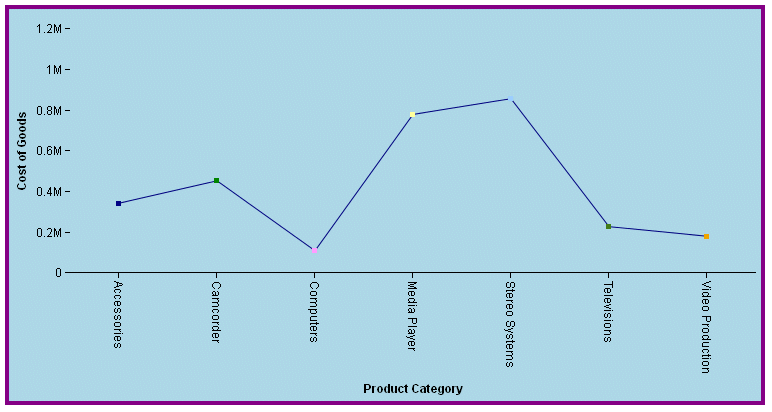
The following request generates a vertical line chart with a light blue fill color:
GRAPH FILE WFLITE
SUM COGS_US
ACROSS PRODUCT_CATEGORY
ON GRAPH HOLD FORMAT JSCHART
ON GRAPH SET LOOKGRAPH VLINE
ON GRAPH SET STYLE *
*GRAPH_JS
fill: {
      color: 'LightBlue'
      },
border: {
      width: 4,
      color: 'purple'
},
series: [
     {series:0, color: 'navy'},
     {series:1, color: 'green'}
]
*END
ENDSTYLE
END
The output is:
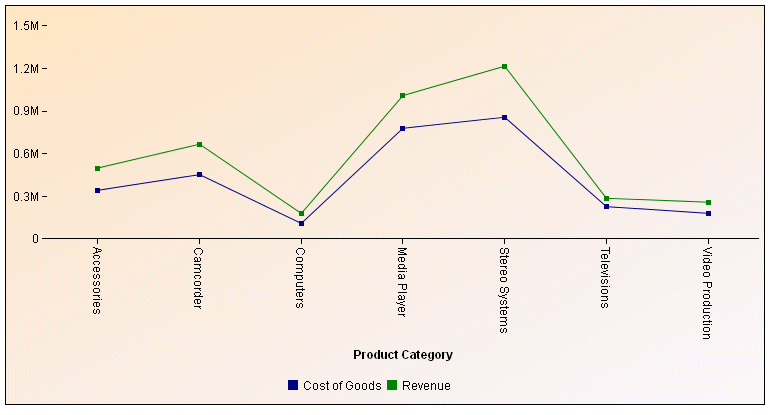
The following request defines a JSON object that applies a linear gradient to the draw area:
GRAPH FILE WFLITE
SUM COGS_US REVENUE_US
ACROSS PRODUCT_CATEGORY
ON GRAPH HOLD FORMAT JSCHART
ON GRAPH SET LOOKGRAPH VLINE
ON GRAPH SET STYLE *
*GRAPH_JS
 fill: {
   color: {
      type: 'linear',
      start: {x: '0%', y: '0%'},
      end: {x: '100%', y: '100%'},
      stops: [
         [0, 'bisque'],[1, 'ghostwhite'],
         ],
      }
},
series: [
     {series:0, color: 'navy'},
     {series:1, color: 'green'}
]
*END
ENDSTYLE
END
The gradient in the draw area transitions from bisque to ghost white: