errorBars: {
   yData: [highValue, markerPosition, lowValue]
   xData: [highValue, markerPosition, lowValue],
   hatWidth: hatwidthval,
   line: {color: 'string',
          width: number,
          dash: 'string'},
   marker: {
      color: color,
      shape: 'string',
      size: number,
      border: {
               width: number,
               color: 'string',
               dash: 'string'
}
   }
}
where:
- yData: [highValue, markerPosition, lowValue, ...] or yData: [highValue, lowValue, ...]
Defines one or more arrays of high values, marker positions (optional), and low values for each riser. For no error bars on y-axis data, the value should be undefined. Each array can have either of the following formats:
- [highValue,lowValue], in which case there will be error bars on the corresponding riser, but no marker.
- [highValue, markerPosition, lowValue], in which case both error bars and a marker will be drawn on the corresponding riser.
- xData: [highValue, markerPosition, lowValue, ...] or xData: [highValue,lowValue, ...]
Defines one or more arrays of high values, marker position (optional), and low values for each riser. For no error bars on x-axis data, the value should be undefined. Each array can have either of the following formats:
- [highValue,lowValue], in which case there will be error bars on the corresponding riser, but no marker.
- [highValue, markerPosition, lowValue], in which case both error bars and a marker will be drawn on the corresponding riser.
- hatWidth: value
Is the width of the error bar as a number in pixels or as a string (enclosed in single quotation marks and including a percent symbol) that specifies a percentage of the width of the riser.
- line:
Defines the properties of the line.
- color: 'string'
Is a color defined by a color name or numeric specification string that defines the color of the line and hats.
For information about defining colors, see Colors and Gradients.
- width: number
Is a number that defines the width of the error bar line in pixels. The default value is 1.
- dash: 'string'
Is a string that defines the dash style of the line. Use a string of numbers that defines the width of a dash followed by the width of the gap between dashes (for example, dash: '1 1' draws a dotted line). Use '' for a solid line.
- marker:
Defines the properties of the markers for a series.
- color: color
Is a color for markers or a series defined by a color name, numeric specification string, or gradient string (enclosed in single quotation marks), or a gradient defined by a JSON Object. The default value is 'grey'.
- shape: 'string'
Is a string that defines the shape of markers for a series. For a list of marker shapes, see Series-Specific Properties. The default value is 'diamond'. Note that bar, circleMinus, circlePlus, cross, and tick markers require a border width and color.
- size: number
Is a number that defines the diameter of the marker in pixels, or undefined (to let the engine choose the marker size). The default value is undefined.
- border:
Defines the properties of the marker border.
- width: number
Is a number that defines the width of the border in pixels. The default value is 'black'.
- color: 'string'
Is a color for the marker border defined by a color name or numeric specification string. The default value is 'black'.
- dash: 'string'
Is a string that defines the marker border dash style. The default value is '' (which generates a solid line). Use a string of numbers that defines the width of a dash followed by the width of the gap between dashes.
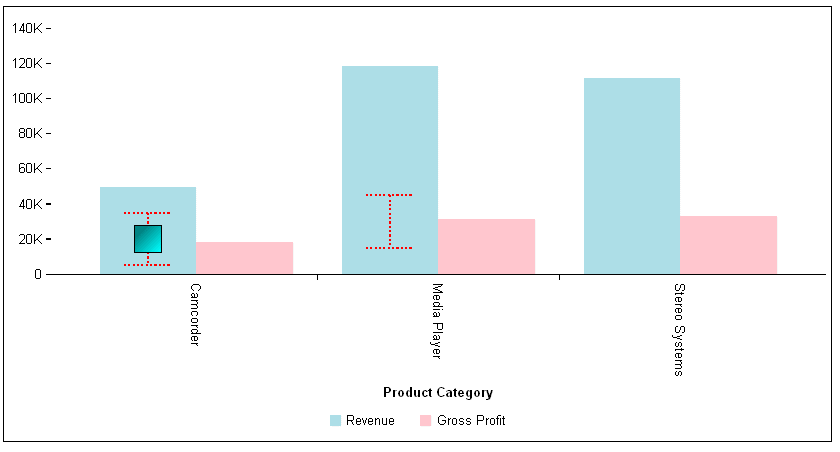
The following request generates red dashed error bars on the first two risers. The error bars on the first riser also include a square marker with a gradient color:
GRAPH FILE WFLITE
SUM REVENUE_US GROSS_PROFIT_US
BY PRODUCT_CATEGORY
WHERE PRODUCT_CATEGORY EQ 'Camcorder' OR 'Media Player' OR 'Stereo Systems'
ON GRAPH HOLD FORMAT JSCHART
ON GRAPH SET LOOKGRAPH VBAR
ON GRAPH SET STYLE *
*GRAPH_JS
  errorBars: {
   hatWidth: '50%',
   yData: [[[5000,20000,35000],[15000, 45000]]],
   line: {color: 'red',width: 2,dash: '2 2'},
   marker: {
      color: 'linear-gradient(0,0,100%,100%, 20% teal, 95% cyan)',
      shape: 'square',
      size: 25,
       }
  },
series: [
{series: 0, color: 'lightblue'},
{series: 1, color: 'pink'},
]
*END
ENDSTYLE
END
The output is:
