Two color modes for heatmaps and choropleths define
the way color transitions are visualized on the chart and in the
legend.
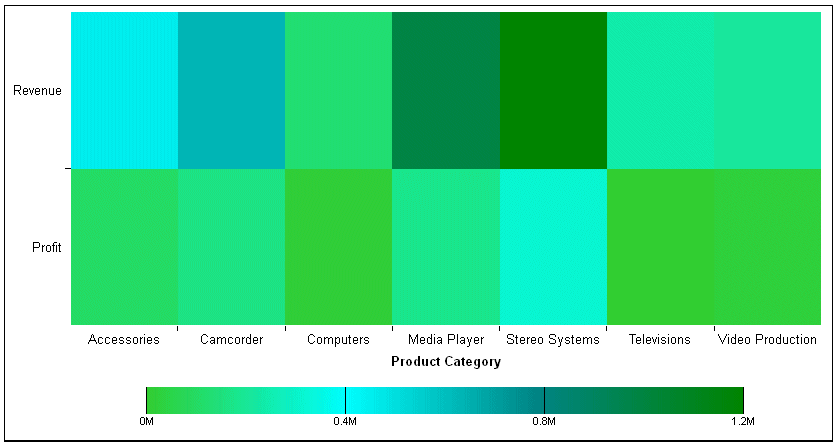
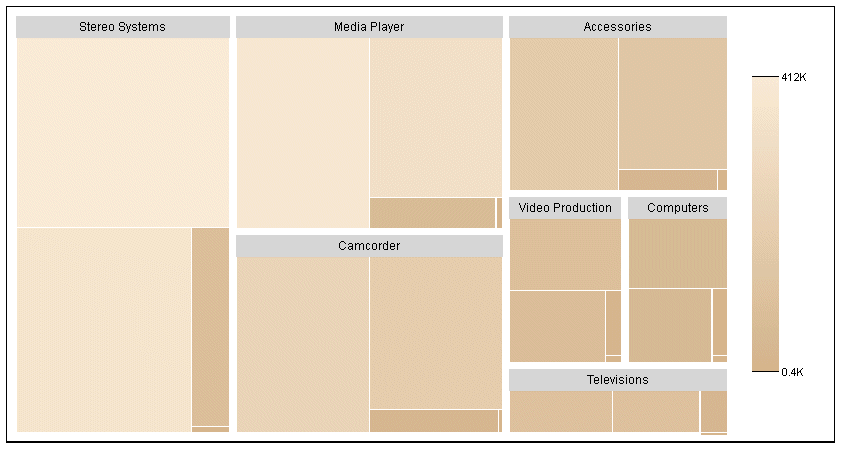
Continuous mode is the default visualization. In continuous mode,
the colors in the color scale form a blended gradient.
Discrete mode visualizes the colorScale in discrete color bands.
You define an array of color bands that provide start and stop values
for each color. The color bands must be defined within the colorScale
object.
x
Syntax: How to Define Discrete a Color Scale for a Heatmap or Choropleth
For
discrete mode, the syntax follows.
colorScale: {
colorMode:'discrete',
colorBands: [
{
start: value,
stop: value,
color: 'string' }
   .
   .
   .
]
}
where:
- start: value
Is a number or percent string that defines where to start
the color band.
- stop: value
Is a number or percent string that defines where to stop
the color band.
- color: ‘string’
Defines the color of the band.
For continuous mode, the syntax follows.
colorScale: {
  colorMode: 'continuous',
  colors: ['string','string', ..., 'string']
}
where:
- colors: ['string','string',
..., 'string']
Specify the colors to be blended.
Note: If
you set the color mode to 'continuous' but define color bands, the chart
will be visualized in discrete mode.
Example: Defining a Discrete Set of Color Bands for a Choropleth
The following request defines a choropleth
with discrete color bands.
Note: Due to their length,
certain lines of syntax in the example below may wrap onto the next
line of text. Wrapping may create breaks within strings or url references, which
may cause errors when run. If you copy and paste this example, be
sure to remove these line breaks before running it.
GRAPH FILE WFLITE
SUM MDN.STATE_PROV_POPULATION
BY STATE_PROV_NAME
WHERE COUNTRY_NAME EQ 'United States'
WHERE STATE_PROV_NAME NE 'Puerto Rico'
ON GRAPH HOLD FORMAT JSCHART
ON GRAPH SET LOOKGRAPH CHOROPLETH
ON GRAPH SET STYLE *
INCLUDE=ENDEFLT,$
*GRAPH_JS
mapProperties: {
  engine: 'leaflet',

leaflet: {
initPos: {
                  center: [37.8, -96],
                  level: 4
            },
overlayLayers: [{
title: 'United States of America',
dataLookup: 'properties.state_name',
layerInfo: {
maxZoom: -1,
minZoom: -1,
type: 'regions'
},
type: 'tdg',
url: function(){ return tdgchart.getScriptPath() + 'map/US.json'}
}],
  controls: [
    {control: 'L.Control.Layers'},
    {
     control: 'L.Control.Scale',
     options: {
      imperial: true,
      metric: true }
    }
   ],
baselayers: [{
title: "ArcGIS_World_Street_Map",
layerInfo: {
maxZoom: 17,
minZoom: 0,
attribution: function(){ return "&|copy; <a target='_blank' href='http://www.InformationBuilders.com'>Information Builders</a> | " + "Map Tiles: &|copy; Esri";}
},
url: function(){return 'http://services.arcgisonline.com/ArcGIS/rest/services/World_Street_Map/MapServer/tile/{z}/{y}/{x}';
}
}]
}
},
legend:{visible:true},
colorScale: {
colorMode:'discrete',
colorBands: [
{start: 0, stop: 8000000,color:'green'},
{start: 8000000, stop: 16000000,color:'yellow'},
{start: 16000000, stop: 24000000,color:'blue'},
{start: 24000000, stop: 38000000,color:'red'}
]
}
*END
ENDSTYLE
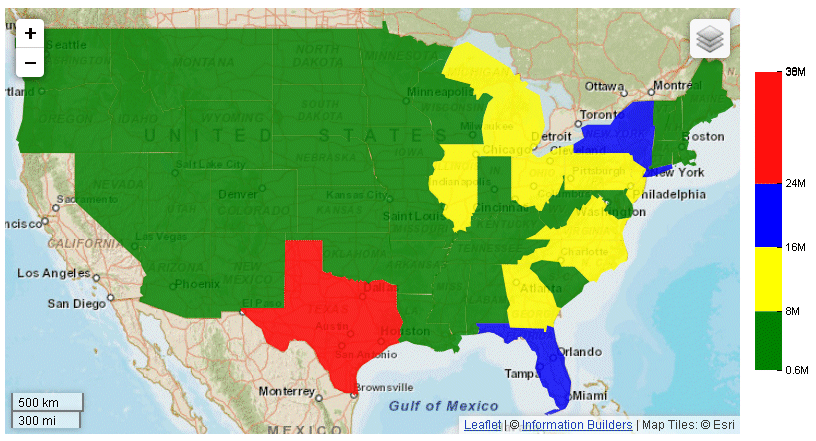
ENDThe chart and legend are
visualized using the discrete color bands defined in the color scale,
as shown on the following image:


