Syntax: How to Set 3D Chart Properties
threedProperties: {
   rotate: number,
   tilt: number,
   shadeSides: boolean
},
where:
- rotate: number
Is a number between 0 and 90 that defines the rotation of the 3D cube. The default value is 40.
- tilt: number
Is a number between 0 and 90 that defines the tilt of the 3D cube. The default value is 40.
- shadeSides: boolean
Valid values are:
- true, to shade 3D risers. This is the default value.
- false, to not shade 3D risers.
Example: Setting Properties for a 3D Area Chart
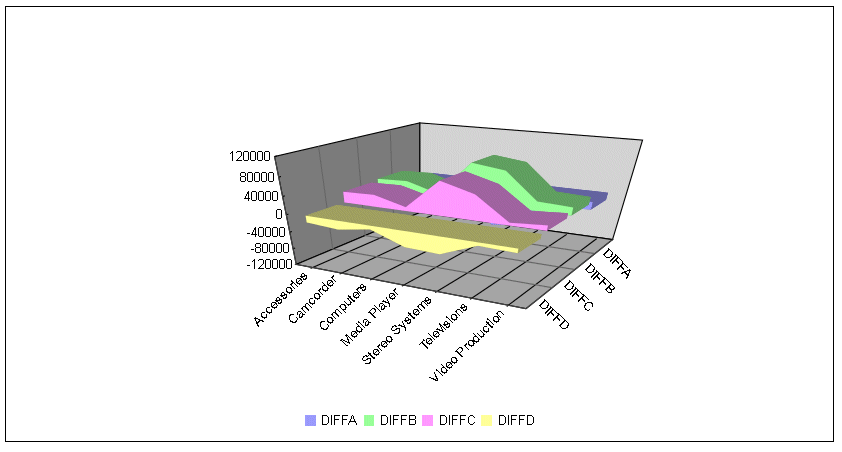
The following request generates a 3D area chart with the default properties:
DEFINE FILE WFLITE
DIFFA = GROSS_PROFIT_US - REVENUE_US;
DIFFB = REVENUE_US - GROSS_PROFIT_US;
DIFFC = COGS_US - (COGS_US * DISCOUNT_US)/100;
DIFFD = COGS_US - MSRP_US;
END
GRAPH FILE WFLITE
SUM DIFFA DIFFB DIFFC DIFFD
BY PRODUCT_CATEGORY
ON GRAPH HOLD FORMAT JSCHART
ON GRAPH SET LOOKGRAPH 3DAREAS
END
The output is:

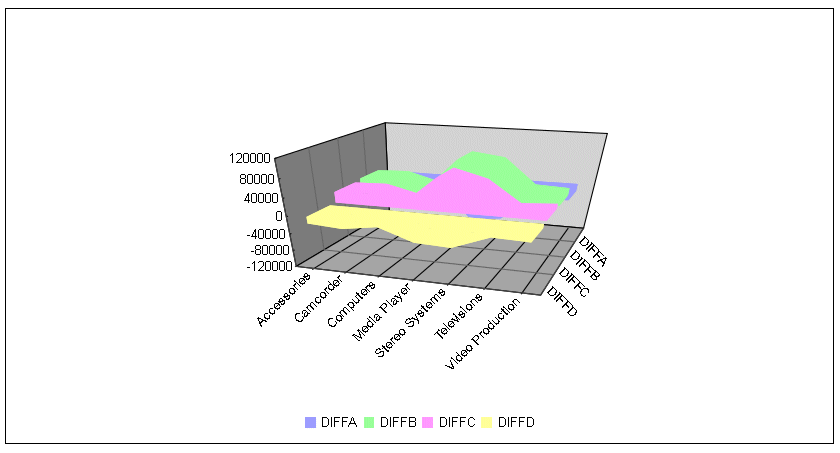
The following version of the request sets the rotation to 20, the tilt to 30, and shadeSides to false:
DEFINE FILE WFLITE
DIFFA = GROSS_PROFIT_US - REVENUE_US;
DIFFB = REVENUE_US - GROSS_PROFIT_US;
DIFFC = COGS_US - (COGS_US * DISCOUNT_US)/100;
DIFFD = COGS_US - MSRP_US;
END
GRAPH FILE WFLITE
SUM DIFFA DIFFB DIFFC DIFFD
BY PRODUCT_CATEGORY
ON GRAPH HOLD FORMAT JSCHART
ON GRAPH SET LOOKGRAPH 3DAREAS
ON GRAPH SET STYLE *
*GRAPH_JS
threedProperties: {
  rotate: 20,
   tilt: 30,
   shadeSides: false}
*END
ENDSTYLE
END
The output is:
