histogramProperties: {
   binCount: number   binSize: size   startBinValue: number},
where:
- binCount: number
Is the number of group labels to draw, or undefined (automatic). The default value is undefined.
- binSize: size
Is the size of the value range for assigning data values to a bin. Can be a number, an array of numbers (for variable bin sizes), or undefined (automatic). If binSize is an array, binCount is ignored and assumed to be the length of the binSize array. The default value is undefined.
- startBinValue: number
Is a number to use as the first bin, or undefined (automatic). The default value is undefined.
Note:
- The blaProperties orientation property draws the chart in horizontal or vertical format. However, instead of using this property, you can control the orientation of the chart using the LOOKGRAPH parameter, which has a value for each histogram orientation. For information about the LOOKGRAPH parameter, see Controlling the Chart Type.
- In a vertical histogram, the y-axis is on the left side of the chart and the x-axis is drawn on the bottom of the chart.
- In a horizontal histogram, the x-axis is on the left side of the chart and the y-axis axis is drawn on the bottom of the chart.
- Use blaProperties:barGroupGapWidth to control the gap between histogram risers.
- The series-specific properties control the colors and borders (if any) of histogram risers.
- Use yaxis properties to control the format of y-axis title and labels.
- Use xaxis properties to control the format of x-axis title and labels. X-axis labels are calculated. They are not defined by the groupLabels property.
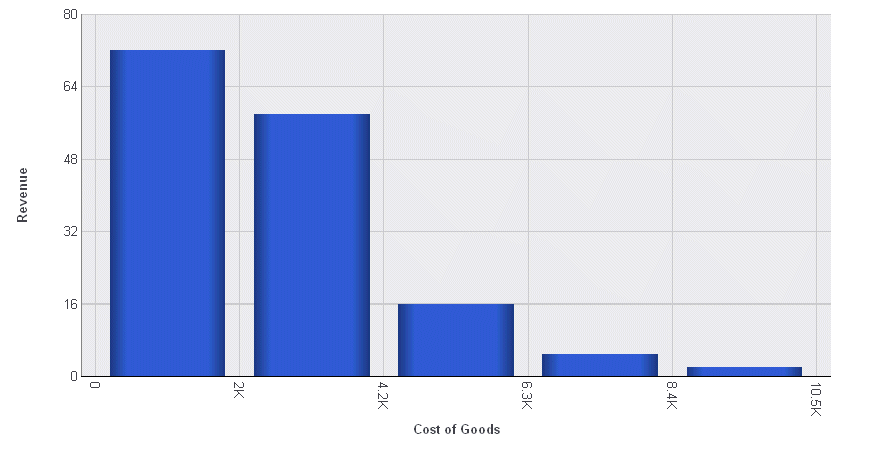
The following request creates a vertical histogram (ON GRAPH SET LOOKGRAPH VHISTOGR) with a bin count of 5:
GRAPH FILE WFLITE
PRINT  REVENUE_US
BY COGS_US
ON GRAPH HOLD FORMAT JSCHART
ON GRAPH SET LOOKGRAPH VHISTOGR
ON GRAPH SET STYLE *
*GRAPH_JS
histogramProperties: {
   binCount: 5,
},
legend: {visible: false},
*END
INCLUDE=ENDEFLT,$
ENDSTYLE
END
The output is:
