Syntax: How to Define the Range of Data to Draw in the Chart
dataSubset: {
   startGroup: number,
   stopGroup: number,
}
where:
- startGroup: number
Is a zero-based starting group number to show. The default value is undefined.
- stopGroup: number
Is a zero-based number identifying the first group that should not be shown. The default value is undefined.
Example: Defining the Range of Data to Show in the Chart
The following request uses Dialogue Manager variables to enable the user to specify the data subset to draw:
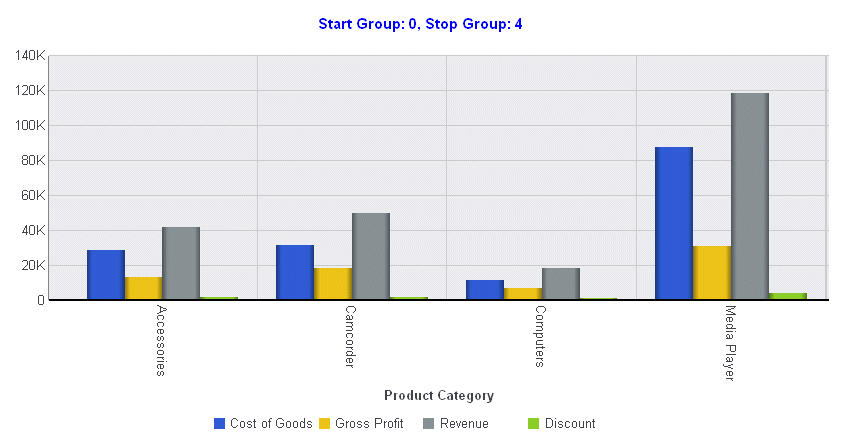
GRAPH FILE WFLITE
SUM COGS_US GROSS_PROFIT_US REVENUE_US DISCOUNT_US
ACROSS PRODUCT_CATEGORY
ON GRAPH HOLD FORMAT JSCHART
ON GRAPH SET LOOKGRAPH VBAR
ON GRAPH SET STYLE *
INCLUDE=ENDEFLT,$
*GRAPH_JS
title: {visible: true, text: 'Start Group: &startg, Stop Group: &stopgp ', color:'blue'},
  dataSubset: {startGroup:'&startg',
                  stopGroup:'&stopgp'}
 *END
ENDSTYLE
END
When the request is run, the user enters the start group number and the stop group number, in this case 0 and 4.
The following chart is generated that shows groups 0 through 3: