In this section: |
All font properties are specified as a string of font attributes (for example, '10pt Sans-Serif'), using the format defined at:
http://www.w3.org/TR/CSS2/fonts.html#font-shorthand.
Fonts always have the properties name, size, style (for example, normal, bold, or italic), and color. Each of these has a default, depending on the fonts installed and available to your browser, and your configuration.
Note: Underline is not supported.
Note that any font you specify must be installed and accessible to the browser.
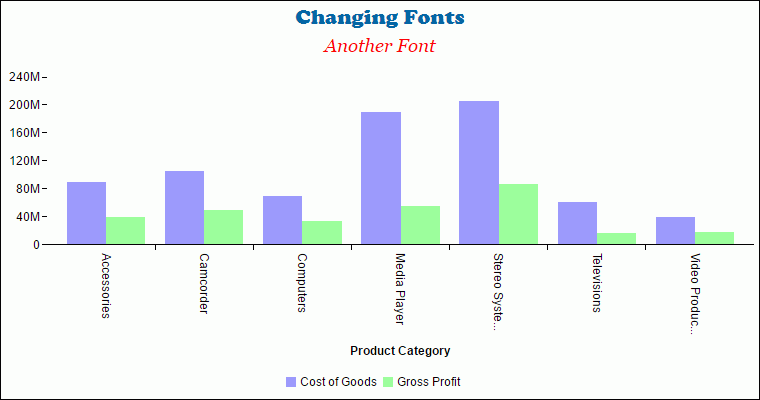
The following request specifies fonts and font characteristics for the chart title and chart subtitle:
GRAPH FILE WFLITE
SUM COGS_US GROSS_PROFIT_US
ACROSS PRODUCT_CATEGORY
ON GRAPH HOLD FORMAT JSCHART
ON GRAPH SET LOOKGRAPH VBAR
ON GRAPH SET STYLE *
*GRAPH_JS
title: {visible:true, text: 'Changing Fonts',
 font: 'bold 16pt Comic Sans MS', color:'rgb(0,101,163)'},
subtitle: {visible: true, text: 'Another Font',
 font: 'bold 14pt Monotype Corsiva', color: 'red'}
*END
ENDSTYLE
END
The output is:

How to: |
You can use Google fonts in your request by pointing to the Google Fonts API, using the SET CSSURL command.
For a list of available Google fonts, see http://www.google.com/fonts.
SET CSSURL='http://fonts.googleapis.com/css?family=font1|font2 ... '
where:
Are Google font names separated by a vertical bar (|).
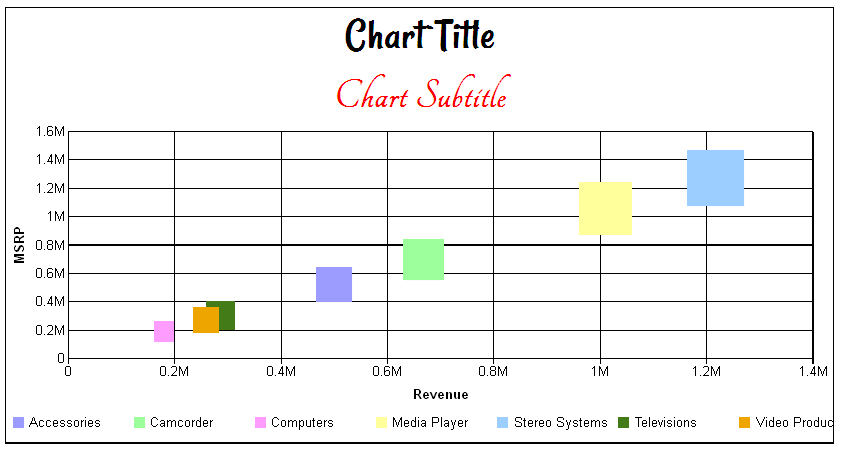
The following request uses the Rancho font for the chart title and the Tangerine font for the chart subtitle:
SET CSSURL='http://fonts.googleapis.com/css?family=Rancho|Tangerine'
GRAPH FILE WFLITE
SUM  REVENUE_US MSRP_US DISCOUNT_US
BY PRODUCT_CATEGORY
ON GRAPH HOLD FORMAT JSCHART
ON GRAPH SET LOOKGRAPH BUBBLE
ON GRAPH SET STYLE *
*GRAPH_JS
title: {
text: 'Chart Title',
visible: true,
align: 'center',
font: 'bold 30pt Rancho',
color: 'black'
},
subtitle: {
text: 'Chart Subtitle',
visible: true,
align: 'center',
font: 'bold 30pt Tangerine',
color: 'red'
},
*END
ENDSTYLE
END
The output is shown in the following image:

| Information Builders |