How to: |
To generate an HTML5 chart, include the following command In your GRAPH FILE request:
ON GRAPH HOLD FORMAT JSCHART
FOCUS styling commands and libraries of JSON objects and legacy graph API calls are available to customize the final output to make it conform to your needs and standards.
If you do not specify JSON properties, default properties will be used. If you do not specify a FOCUS StyleSheet to be used, default styles will be used.
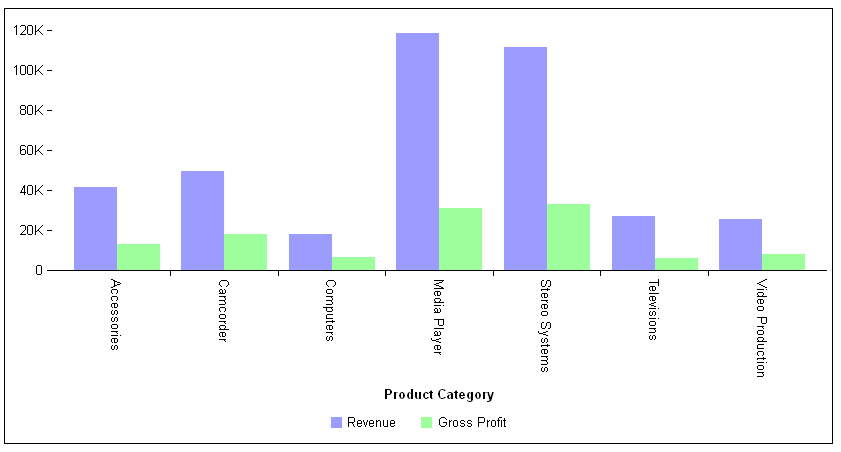
The following request against the WFLITE data source creates an HTML5 vertical bar chart. As it includes no StyleSheet or JSON properties, default properties are used:
GRAPH FILE WFLITE
SUM REVENUE_US GROSS_PROFIT_US
BY PRODUCT_CATEGORY
ON GRAPH HOLD FORMAT JSCHART
ON GRAPH SET LOOKGRAPH VBAR
END
The output is:

You can use the SET AUTOFIT command to make the HTML5 output resize to fit into the container in which it is placed.
ON GRAPH SET AUTOFIT {OFF|ON|RESIZE}where:
Respects the dimensions specified by the HAXIS and VAXIS parameters.
Always resizes the HTML5 chart output to fit its container.
Respects the dimensions specified by the HAXIS and VAXIS parameters initially, but resizes the chart output if the container is resized.
Note:
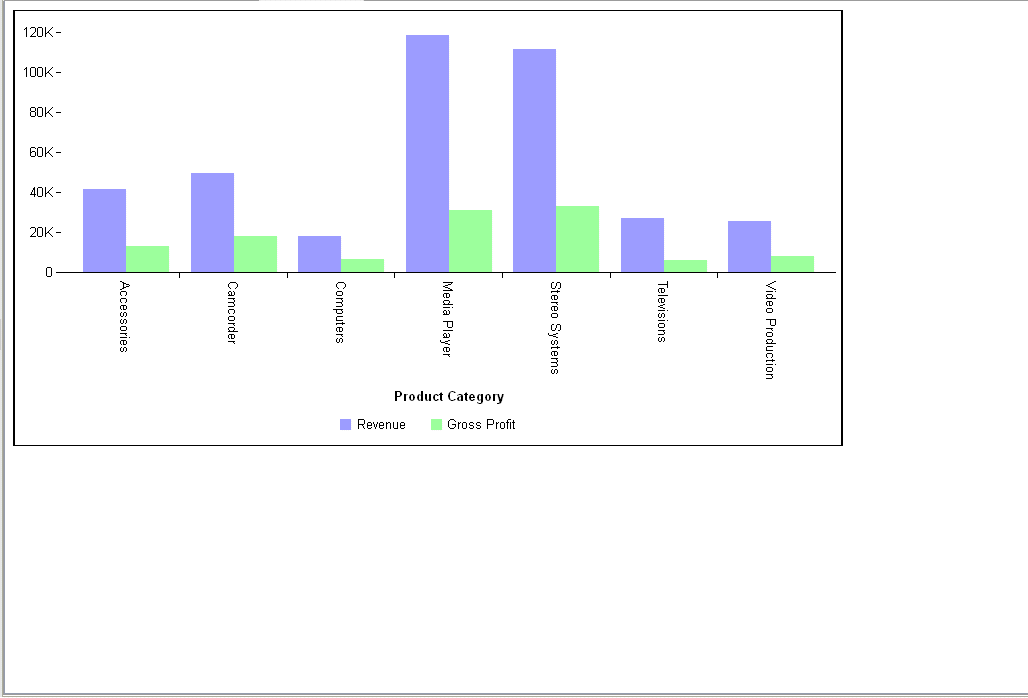
The following request created a vertical bar chart. the AUTOFIT parameter is set to OFF:
SET AUTOFIT = OFF
GRAPH FILE WFLITE
SUM REVENUE_US GROSS_PROFIT_US
BY PRODUCT_CATEGORY
ON GRAPH HOLD FORMAT JSCHART
ON GRAPH SET LOOKGRAPH VBAR
END
The size of the chart is controlled by the default settings for the HAXIS and VAXIS parameters:

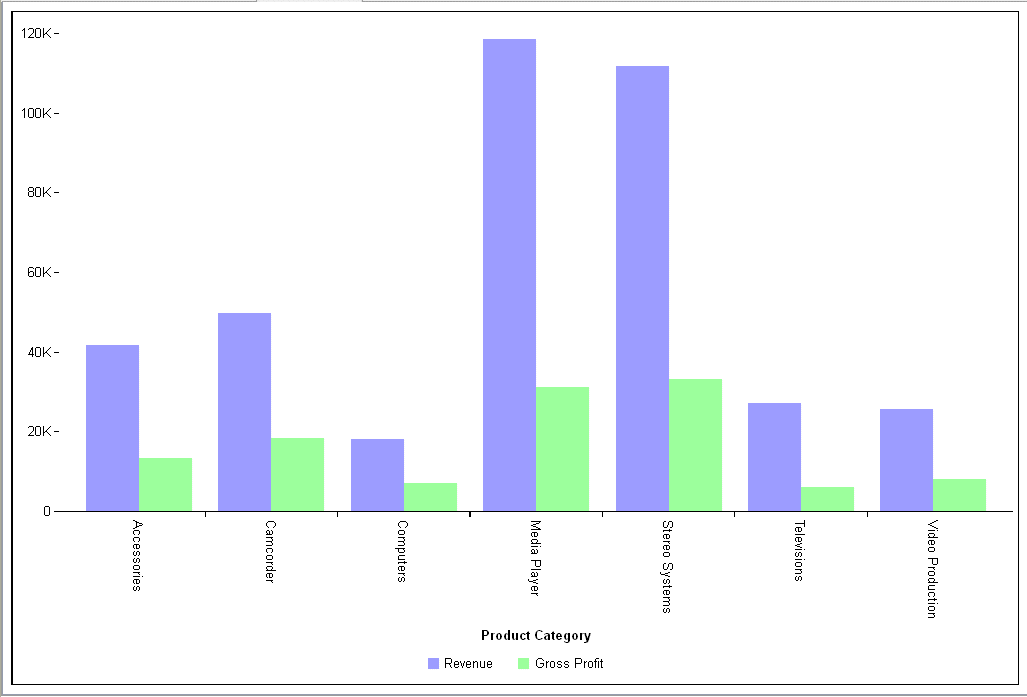
If you change the AUTOFIT parameter value to ON, the chart is drawn using the entire page, ignoring the HAXIS and VAXIS values.

It then resizes if you resize the container.
Changing the AUTOFIT setting to RESIZE initially renders the chart as with the OFF setting, but resizes it if the container is reduced or enlarged.
| Information Builders |