interaction: {
   click: 'string',
   mousedrag: 'string',
   dblclick: 'string',
   mousemove : 'string'
},
where:
- click: 'string'
Is a string that defines interaction on mouse click. Valid values are:
- 'otherSliceDrillDown', which shows the slices that make up the other slice.
- undefined. This is the default value.
- mousedrag: 'string'
Is a string that defines the interaction on mouse drag:
- 'select', which selects a chart riser and marker.
- 'pan', which on mouse drag, shows other values in the data set.
- 'rotate', which for 3D charts only, rotates the 3D cube.
- undefined, which does nothing. This is the default value.
- dblclick: 'string'
Is a string that defines the interaction on mouse double click. Valid values are:
- 'resetView', which works with 'pan' and 'rotate'. It causes a double-click to reset the chart to its original view.
- undefined. This is the default value.
- mousemove: 'string'
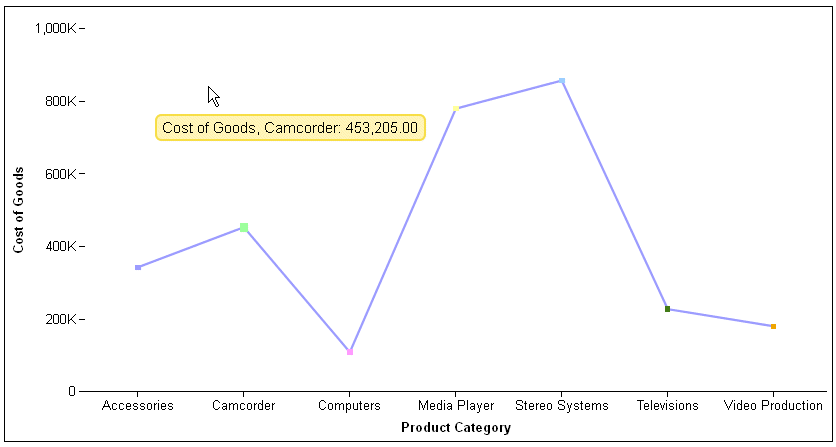
Specifies a tooltip detection method for line, scatter, and area charts. Valid values are:
- 'over', which only displays a tooltip when the mouse hovers directly over a data point. This is the default value.
- 'nearestNeighbor', which displays the tooltip for the nearest data point on line, scatter, and area charts, even when the mouse moves away from a data point.
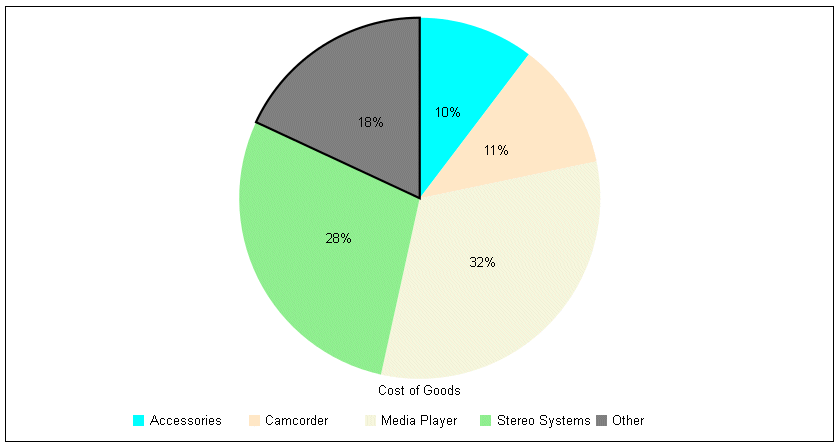
The following request generates a pie chart with the otherSlice set to a threshold of 8%. The interaction setting causes the chart to show the components of the otherSlice when the user clicks the other slice:
GRAPH FILE WFLITE
SUM COGS_US
ACROSS PRODUCT_CATEGORY
ON GRAPH HOLD FORMAT JSCHART
ON GRAPH SET LOOKGRAPH PIE
ON GRAPH SET STYLE *
*GRAPH_JS
dataLabels: {visible:true},
pieProperties: {otherSlice: {threshold: '8%'}},
  interaction:{
    click: 'otherSliceDrillDown'
     }  ,
series: [
   {series: 0, color: 'cyan', showDataValues:true},
   {series: 1, color: 'bisque', showDataValues:true},
   {series: 2, color: 'slateblue', showDataValues:true},
   {series: 3, color: 'beige', showDataValues:true},
   {series: 4, color: 'lightgreen', showDataValues:true},
   {series: 5, color: 'yellow', showDataValues:true},
   {series: 6, color: 'lightblue', showDataValues:true},
   {series: 7, color: 'lavender', showDataValues:true},
   {series: 8, color: 'limegreen', showDataValues:true},
   {series: 9, color: 'red', showDataValues:true}
]
*END
ENDSTYLE
END
On the output, the slices with values below the threshold percent are grouped together in one grey slice:
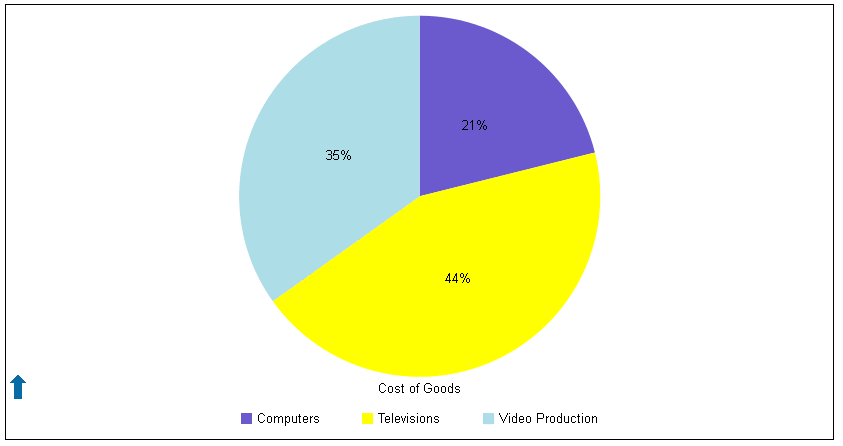
Clicking the other slice generates the following drill down of the other slice, showing the components and their percentages within the other slice. The blue arrow on the bottom left resets the original view, when clicked:
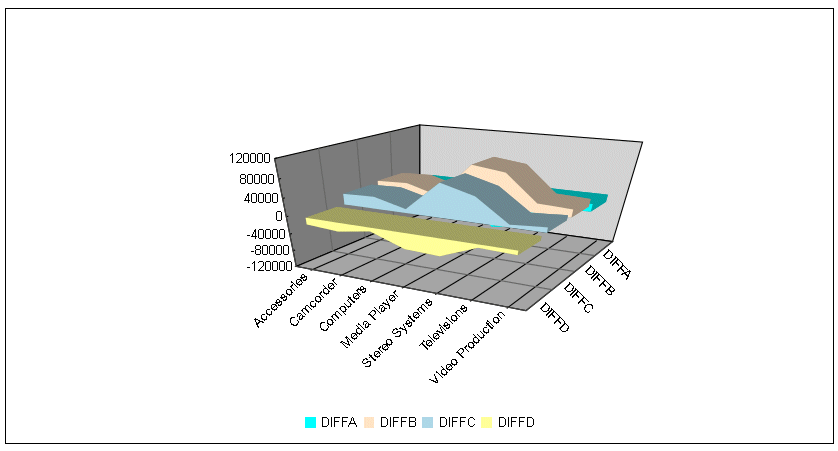
The following request generates a 3D area chart. The interaction properties enable rotating the chart on mousedrag and resetting the original view on double-click:
DEFINE FILE WFLITE
DIFFA = GROSS_PROFIT_US - REVENUE_US;
DIFFB = REVENUE_US - GROSS_PROFIT_US;
DIFFC = COGS_US - (COGS_US * DISCOUNT_US)/100;
DIFFD = COGS_US - MSRP_US;
END
GRAPH FILE WFLITE
SUM DIFFA DIFFB DIFFC DIFFD
BY PRODUCT_CATEGORY
ON GRAPH HOLD FORMAT JSCHART
ON GRAPH SET LOOKGRAPH 3DAREAS
ON GRAPH SET STYLE *
*GRAPH_JS
  interaction:
      {mousedrag: 'rotate',
      dblclick: 'resetView'},
series: [
    {series: 0, color: 'cyan'},
    {series: 1, color: 'bisque'},
    {series: 2, color: 'lightblue'},
]
*END
ENDSTYLE
END
The following image shows the original view of the chart:
Clicking outside the chart and dragging rotates the chart:
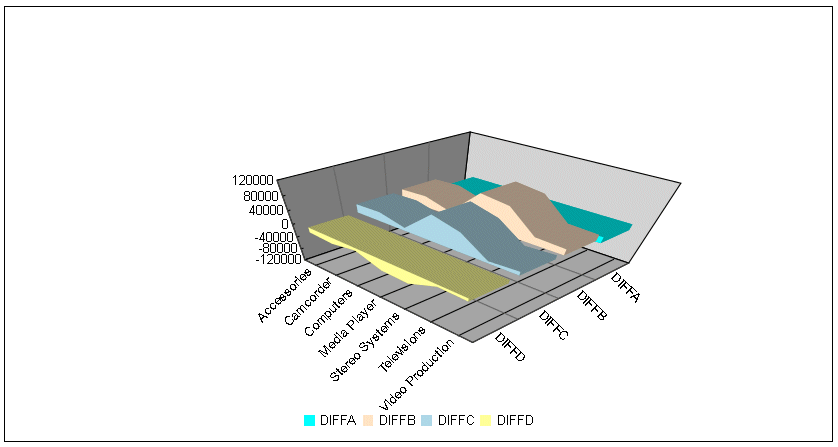
Double-clicking outside the chart resets it to its original view.
The following request generates a line chart with nearest neighbor tooltip detection:
GRAPH FILE WFLITE
SUM COGS_US
BY  PRODUCT_CATEGORY
ON GRAPH HOLD FORMAT JSCHART
ON GRAPH SET LOOKGRAPH VLINE
ON GRAPH SET STYLE *
*GRAPH_JS
interaction: {
 mousemove : 'nearestNeighbor'
},
*END
END
The following image shows that the tooltip is visible even though the mouse is not hovering over a data point on the chart:
