htmlToolTip: {
   enabled: boolean,
   mouseMargin: number,
   style: 'string',
   autoTitleFont: 'string',
   autoContentFont: 'string',
   snap: boolean   }
where:
- enabled: boolean
Enables or disables HTML-based tooltips. Valid values are:
- true, which uses HTML-based tooltips for all chart tooltips.
- false, which uses standard style tooltips for all chart tooltips. This is the default value.
- mouseMargin: number
Is the distance from the top of the cursor to the bottom of the tooltip, in pixels.
- style: 'string'
Defines the style of the tooltip. Valid values are:
- 'seriesFill', which fills the tooltip background with a lightened version of the series color.
- an object or string defining CSS properties.
- undefined. This is the default value.
- autoTitleFont: 'string'
When series:tooltip is set to 'auto', use a CSS font string to define the formatting of automatic tooltip title text. The default value is 'bold 12pt Sans-Serif'.
- autoContentFont: 'string'
When series:tooltip is set to 'auto', use a CSS font string to define the formatting of automatic tooltip content text. The default value is '10pt Sans-Serif'.
- snap: boolean
Enables or disables sticky tooltips. Valid values are:
- true, to enable sticky tooltips. The tooltip is only hidden when the mouse moves out of the chart frame.
- false, to disable sticky tooltips. The tooltip is hidden when the mouse moves off any riser. This is the default value.
The following request generates HTML-based tooltips:
GRAPH FILE WFLITE
SUM REVENUE_US GROSS_PROFIT_US COGS_US MSRP_US
BY PRODUCT_CATEGORY
WHERE PRODUCT_CATEGORY EQ 'Camcorder' OR 'Media Player' OR 'Stereo Systems'
ON GRAPH HOLD FORMAT JSCHART
ON GRAPH SET LOOKGRAPH VBAR
ON GRAPH SET STYLE *
*GRAPH_JS
series: [
   {series: 0, color: 'lightgreen'},
   {series: 1, color: 'tan'},
   {series: 2, color: 'lightblue'},
   {series: 3, color: 'beige'},
   ],
  htmlToolTip: {enabled: true,  snap: true}
*END
ENDSTYLE
END
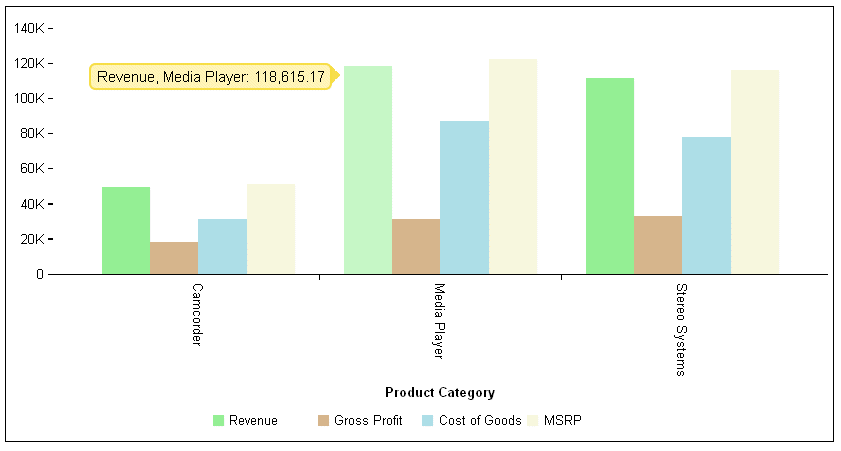
On the output, the tooltips have callout arrows because the snap property is enabled:

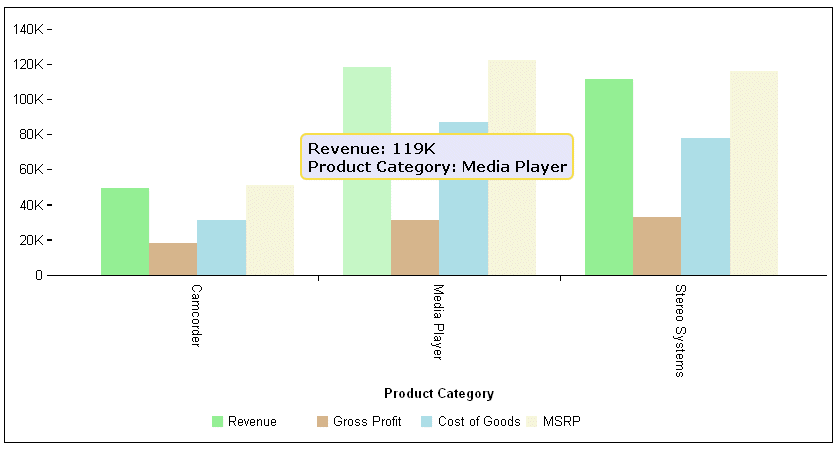
The following version of the request formats the background color of the tooltips and the font of the tooltip for series 0, which has been set to tooltip:'auto':
GRAPH FILE WFLITE
SUM REVENUE_US GROSS_PROFIT_US COGS_US MSRP_US
BY PRODUCT_CATEGORY
WHERE PRODUCT_CATEGORY EQ 'Camcorder' OR 'Media Player' OR 'Stereo Systems'
ON GRAPH HOLD FORMAT JSCHART
ON GRAPH SET LOOKGRAPH VBAR
ON GRAPH SET STYLE *
*GRAPH_JS
series: [
   {series: 0, color: 'lightgreen', tooltip:'auto'},
   {series: 1, color: 'tan'},
   {series: 2, color: 'lightblue'},
   {series: 3, color: 'beige'},
   ],
  htmlToolTip: {enabled: true,
   style: {background: 'lavender'},
   autoTitleFont: 'italic 12pt Times New Roman',
   autoContentFont: 'bold 10pt Verdana'
  },
*END
ENDSTYLE
END
The output is:
