annotations: [
 position: {
   x: x   y: y,
   parent: 'string'
     },
 marker: {
   visible: boolean,
   color: ‘string’,
   size: number,
   shape: 'string',
   rotation: number,
   border: {
     width: number,
     color: 'string',
     dash: 'string'
         }
     },
 label: {
         visible: boolean,
         text: 'string',
         font: 'string',
         color: 'string',
         position: 'string'
     }
 },
   .
   .
   .
]
where:
- position:
Defines the position of the annotation marker.
- x: x
Is the horizontal position for the annotation marker. Can be:
- A number. If the parent chart component is 'chart', the number represents a value on a numeric axis. Otherwise, it represents a number of pixels from the lower left corner of the parent component.
- A series and group label for a horizontal chart (in the form {series:n,group:m}), which places the annotation on that series or group. This requires the parent component to be 'chart'.
- A percent string (for example, ‘40%'), which places the annotation at a point the specified percentage horizontally from the lower left corner of the parent component.
- A pixel string (for example, '40px'), which places the annotation at a point that number of pixels horizontally from the lower left corner of the parent component.
- y: y
Is the vertical position for the annotation marker. Can be:
- A number. If the parent chart component is 'chart', the number represents a value on a numeric axis. Otherwise, it represents a number of pixels from the lower left corner of the parent component.
- A series and group label for a vertical chart (in the form {series:n,group:m}), which places the annotation on that series or group. This requires the parent component to be 'chart'.
- A percent string (for example, ‘40%'), which places the annotation at a point the specified percentage vertically from the lower left corner of the parent component.
- A pixel string (for example, '40px'), which places the annotation at a point that number of pixels vertically from the lower left corner of the parent component.
- parent: 'string'
Can be one of the following chart components:
- 'background', which measures the position from the lower left corner of the chart frame and places the annotation behind the chart. This is the default value.
- 'chart', which measures the position from the lower left corner of the chart draw area and places the annotation on the chart.
- 'legend', which measures the position from the lower left corner of the legend area and places the annotation in the legend area.
- marker:
Defines the properties of the annotation marker.
- visible: boolean
Defines whether the annotation marker is visible. Valid values are:
- true, which makes the annotation marker visible. This is the default value.
- false, which makes the annotation marker not visible.
- color: ‘string’
Defines the color for the annotation marker, defined by a color name or numeric specification string, or a gradient defined by a string. The default value is 'red'.
- size: number
Is the size, in pixels, of the annotation marker. The default value is 8.
- shape: 'string'
Is a shape for the annotation marker. All valid marker shapes are supported. The default shape is 'circle'.
For a list of marker shapes, see Series-Specific Properties.
- position: ‘string’
Defines the marker position relative to data text labels for bullet charts as 'top', 'bottom', or 'middle', Not supported for other types of charts.
- rotation: number
Is a number between 0 and 360 that defines the rotation angle of the marker, in degrees.
- border:
Defines the properties of the marker border.
- width: number
Is a number that defines the width of the border in pixels. The default value is 1.
- color: 'string'
Is a color for the marker border defined by a color name or numeric specification string. The default value is 'black'.
- dash: 'string'
Is a string that defines the border dash style. Use a string of numbers that defines the width of a dash followed by the width of the gap between dashes. The default is no dash ('').
- label:
Defines the properties of the annotation label.
- visible: boolean
Defines whether the annotation label is visible. Valid values are:
- true, which makes the annotation label visible. This is the default value.
- false, which makes the annotation label not visible.
- text: 'string'
Defines the annotation label text. The default value is no label text.
- font: 'string'
Defines the annotation label font. The default value is '10pt Sans-Serif'.
- color: 'string'
- Defines the annotation label color defined by a color name or numeric specification string. The default value is 'black'.
- position: 'string'
Defines a position for the annotation label relative to the annotation marker. Valid values are:
- 'top', which places the annotation label above the annotation marker.
- 'bottom', which places the annotation label below the annotation marker.
- 'left', which places the annotation label to the left of the annotation marker.
- 'right', which places the annotation label to the right of the annotation marker.
- 'center', which places the annotation label centered on the annotation marker. This is the default value.
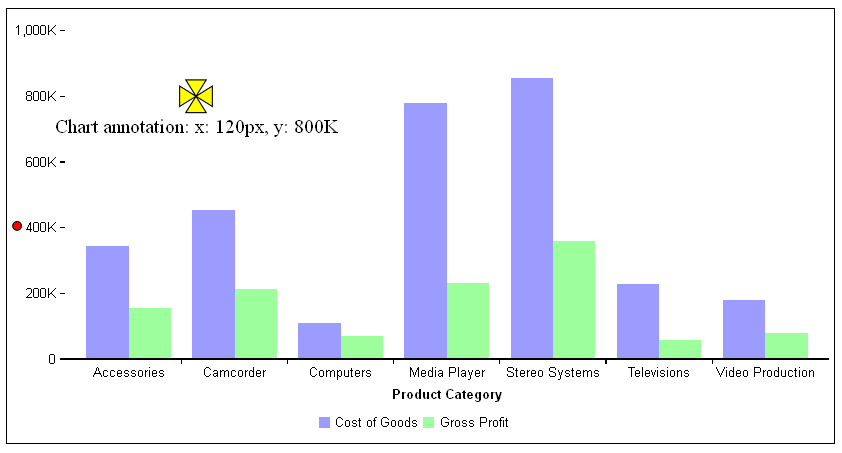
The following request specifies two annotations. The first annotation is on the chart component. Its marker is a yellow pirate cross with a black border that is 120 pixels horizontally from the left edge of the x-axis and at the 800K point along the y-axis (which is numeric). The label is positioned below the marker. The second annotation only has a position (representing pixels), so there is no label, and it has the default marker, a red circle that is 8 pixels in size.
GRAPH FILE WFLITE
SUM COGS_US GROSS_PROFIT_US
BY PRODUCT_CATEGORY
ON GRAPH HOLD FORMAT JSCHART
ON GRAPH SET LOOKGRAPH VBAR
ON GRAPH SET STYLE *
*GRAPH_JS
annotations : [
    {
     position: {
       x: '120px',
       y: 800000,
       parent: 'chart'
       },
     marker: {
       visible: true,
       color: 'yellow',
       size: 30,
       shape: 'piratecross',
       rotation: 0,
       border: {
         width: 1,
         color: 'black',
         dash: ''
           }
       },
    label: {
       visible: true,
           text: 'Chart annotation: x: 120px, y: 800K',
           font: '14pt Times New Roman',
           color: 'black',
           position: 'bottom'
       }
   },
   {
   position: {
     x: 10,
     y: 200
       }
   },
  ]
*END
ENDSTYLE
END
The output is:

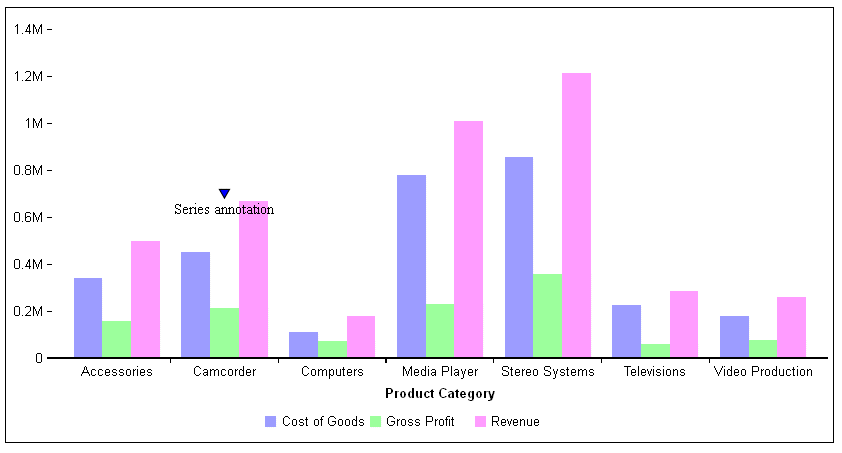
The following request has one annotation, on series 1 and group 1. The y value is at 50% along the y-axis. The marker is a blue triangle.
GRAPH FILE WFLITE
SUM COGS_US GROSS_PROFIT_US REVENUE_US
BY PRODUCT_CATEGORY
ON GRAPH HOLD FORMAT JSCHART
ON GRAPH SET LOOKGRAPH VBAR
ON GRAPH SET STYLE *
*GRAPH_JS
annotations : [
    {
     position: {
       x: {series:1, group:1},
       y: '50%',
       parent: 'chart'
       },
     marker: {
       visible: true,
       color:'blue',
       shape: 'triangle',
       rotation: 0,
       border: {
          width: 1,
          color: 'black',
          dash: ''
           }
       },
     label: {
       visible: true,
       text: 'Series annotation',
       font: '10pt Times New Roman',
       color: 'black',
       position: 'bottom'
       }
   },
  ]
*END
ENDSTYLE
END
The output is:

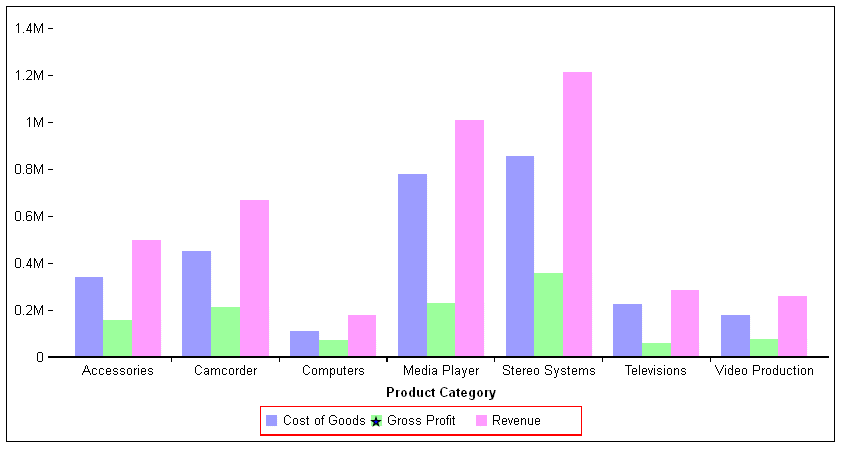
The following request places a blue star over the green legend marker in the legend area.
GRAPH FILE WFLITE
SUM COGS_US GROSS_PROFIT_US REVENUE_US
BY PRODUCT_CATEGORY
ON GRAPH HOLD FORMAT JSCHART
ON GRAPH SET LOOKGRAPH VBAR
ON GRAPH SET STYLE *
*GRAPH_JS
legend: {lineStyle:{color:'red'}},
annotations : [
    {
     position: {
       x: '106px',
       y: '.14px',
       parent: 'legend'
       },
     marker: {
       visible: true,
       color:'blue',
       shape: 'fiveStar',
       rotation: 0,
       border: {
         width: 1,
         color: 'black',
         dash: ''
           }}
       },

  ]
*END
ENDSTYLE
END
The output is:
