Funnel Chart Properties (funnelProperties)

In this section:

A funnel chart is basically a pie chart that shows only one group of data at a time. The series in the group are stacked in the funnel with the first series at the top and the last series at the bottom. In a funnel chart, the display field functions as the group, and the sort field values function as the series.

These properties control the general layout of a funnel chart.

The following code segment shows the default values:

funnelProperties: {
   topWidth: '100%',   
   baseWidth: '20%',  
   riserGap: 0,       
   groupLabel: {
      visible: false,
      font: '10pt Sans-Serif',
      color: 'black'
   }
},

Series-specific properties control the color of funnel segments.


Top of page

x
Controlling the Width at the Top of the Funnel

How to:

The topWidth property controls the width of the top of the funnel.


x
Syntax: How to Control the Width at the Top of the Funnel
funnelProperties: {
   topWidth: width}

where;

topWidth: width

Can be a number that defines the width in pixels or a string that includes a percent symbol, enclosed in single quotation marks ('), that represents a percentage of the available space in the frame (that is, '0%' through '100%'). The default value is '100%'.


Example: Controlling the Width at the Top of the Funnel

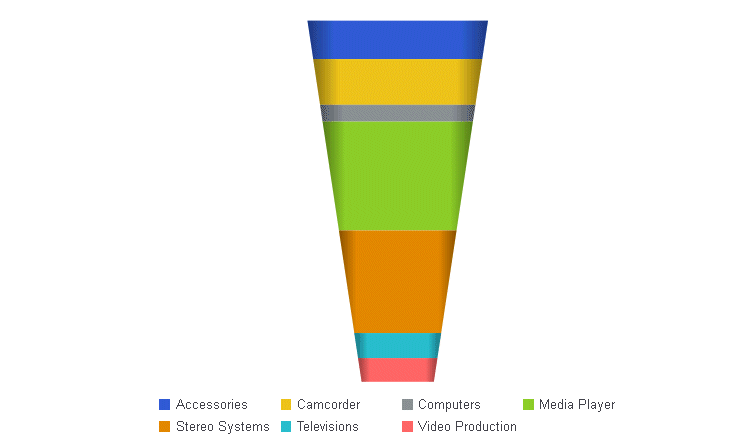
The following request creates a funnel chart in which the top width is reduced to 50%:

GRAPH FILE WFLITE
SUM  REVENUE_US 
BY PRODUCT_CATEGORY
ON GRAPH HOLD FORMAT JSCHART
ON GRAPH SET LOOKGRAPH FUNNEL
ON GRAPH SET STYLE *
INCLUDE=ENDEFLT,$
*GRAPH_JS
legend: {visible: true}, 
funnelProperties: {
   topWidth: '50%'   
}
*END
ENDSTYLE
END

The output is:


Top of page

x
Controlling the Width at the Base of the Funnel

How to:

The baseWidth property controls the width of the base of the funnel.


x
Syntax: How to Control the Width at the Base of the Funnel
funnelProperties: {
   baseWidth: width}

where;

baseWidth: width

Can be a number that defines the width in pixels, or a string that includes a percent symbol, enclosed in single quotation marks ('), that represents a percentage value (that is, from '0%' to 100%'). The default value is '20%'.


Example: Controlling the Width at the Base of the Funnel

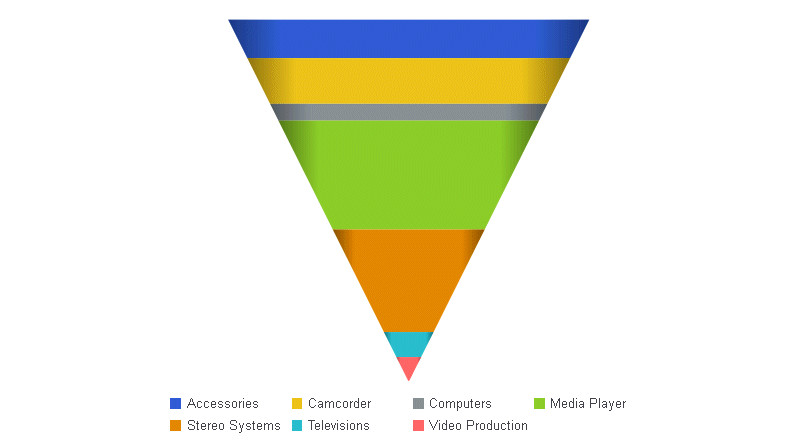
The following request creates a funnel chart in which the base width is 1 pixel:

GRAPH FILE WFLITE
SUM  REVENUE_US 
BY PRODUCT_CATEGORY
ON GRAPH HOLD FORMAT JSCHART
ON GRAPH SET LOOKGRAPH FUNNEL
ON GRAPH SET STYLE *
INCLUDE=ENDEFLT,$
*GRAPH_JS
legend: {visible: true}, 
funnelProperties: {
   baseWidth: 1   
}
*END
ENDSTYLE
END

The output is:


Top of page

x
Controlling the Space Between Layers in a Funnel Chart

How to:

The riserGap property controls the empty space between layers in the funnel.


x
Syntax: How to Control the Space Between Layers in a Funnel Chart
funnelProperties: {
   riserGap: gap},

where:

riserGap: gap

Can be a number that defines the width of the riser gap in pixels, or a string that includes a percent symbol, enclosed in single quotation marks ('), that represents a percentage value '0%' to '100%' (of average riser height). For example, riserGap: '10%' will use 10% of each funnel layer as white space between each segment. The default value is zero (0).


Example: Controlling the Gap Between Funnel Layers

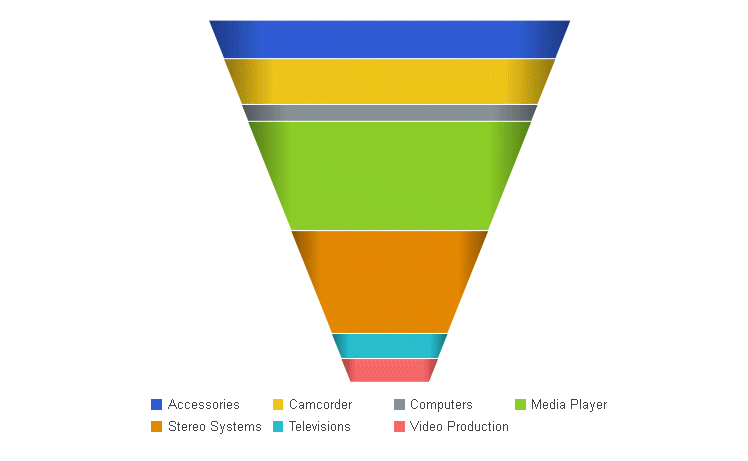
The following request creates a funnel chart in which the gap between layers is 1 pixel:

GRAPH FILE WFLITE
SUM  REVENUE_US 
BY PRODUCT_CATEGORY
ON GRAPH HOLD FORMAT JSCHART
ON GRAPH SET LOOKGRAPH FUNNEL
ON GRAPH SET STYLE *
INCLUDE=ENDEFLT,$
*GRAPH_JS
legend: {visible: true}, 
funnelProperties: {
    riserGap: 1   
}
*END
ENDSTYLE
END

The output is:


Top of page

x
Formatting the Group Label in a Funnel Chart

How to:


x
Syntax: How to Format a Funnel Chart Group Label

The groupLabel properties control the visibility and format of the group label in a funnel chart.

These properties do not control the text that displays as the group label. That is controlled by the general groupLabels property. The default group label is the field name for the measure in the request.

funnelProperties: {
   groupLabel: {
      visible: boolean,
      font: 'string',
      color: 'string'
   },
},

where:

visible: boolean

Valid values are:

  • true, which makes the group label visible.
  • false, which makes the group label not visible. This is the default value.
font: 'string'

Is a string that defines the size, style, and, typeface of the label. The default value is '10pt Sans-Serif'.

color: 'string'

Is a string that defines the color of the label. The default value is 'black'.


Example: Controlling a Funnel Chart Group Label

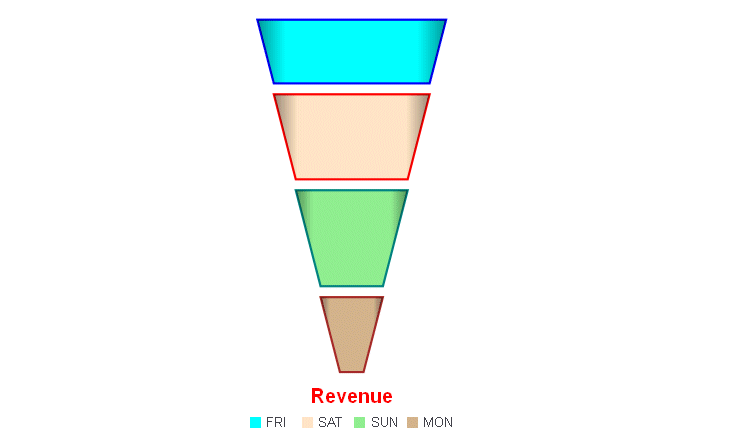
The following request creates a funnel chart with a red group label in a 14pt Sans-Serif font. The top width is 50%, the base width is 1 pixel, and the riser gap is 10 pixels. The group label is the measure field name (the default label):

GRAPH FILE WFLITE
SUM  REVENUE_US 
ACROSS TIME_DAYNAME COLUMNS 'FRI' AND 'SAT' AND 'SUN' AND 'MON'
ON GRAPH HOLD FORMAT JSCHART
ON GRAPH SET LOOKGRAPH FUNNEL
ON GRAPH SET STYLE *
INCLUDE=ENDEFLT,$
*GRAPH_JS
legend: {visible: true}, 
funnelProperties: {
   topWidth: '50%', 
   baseWidth: 1,
   riserGap: 10,
   groupLabel: {
      visible: true,
      font: 'bold 14pt Sans-Serif',
      color: 'red'     
   }            
},
series: [
   {series: 0, color: 'cyan', border: {width: 2, color: 'blue'}},
   {series: 1, color: 'bisque', border: {width: 2, color: 'red'}},
   {series: 2, color: 'lightgreen', border: {width: 2, color: 'teal'}},
   {series: 3, color: 'tan', border: {width: 2, color: 'brown'}},
]
*END
ENDSTYLE
END

The output is:


Information Builders