The following topics have general applicability for
many graph applications:
- How does
FOCUS handle dates in graphs?
- How is missing
data handled?
- Is it possible
to save formatted graphic output and display it later?
- Is it possible
to send graphs to a Personal Computer for display?
- What is the
nature of the interface between FOCUS and CA-TELLAGRAF?
- What is the
nature of the interface between FOCUS and ICU (Interactive Chart Utility)?
These are described in the following sections.
x
Numerical fields containing dates are recognized by
FOCUS through the formats in their Master Files. Such fields are
interpreted by FOCUS if you name them in ACROSS or BY phrases in
GRAPH requests. To review the various format types, see the Describing
Data manual.
When plotting dates, FOCUS handles them in the following manner:
- If the
date field named has a month format, it is plotted in ascending
time order (even though the file is not sorted in ascending date
order). Hence, month/year values of 01/76, 03/76, 09/75 are plotted
by month within year: 09/75, 01/76, 03/76.
- Axis scaling
is performed on the basis of days in the month and months in the
year. When the date format includes the day, the scale usually starts
at the first day of the month as the zero axis point.
You may wish to selectively combine groups of date point plots
to reduce the number of separate points on the horizontal axis.
Do this with the IN-GROUPS-OF option. For example, if the date field
format is I6YMD, you can display the data by month rather than by day
by grouping it in 30-day increments:
ACROSS DATE IN-GROUPS-OF 30
This eliminates plot points for individual days. If your date
format is in a legacy YMD format you could also redefine the format
and divide the field contents by 100 to eliminate the days:
DATE/I4YM=DATE/100
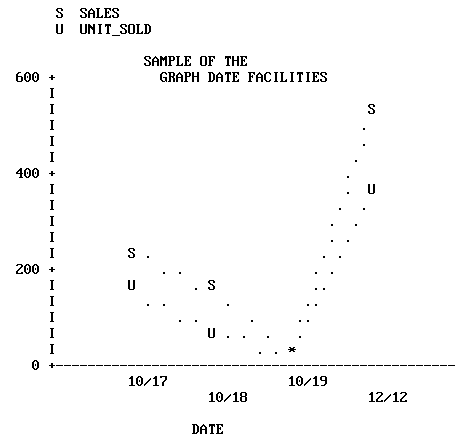
The example that follows illustrates a graph with date plots.
Run it as an offline request:
SET HISTOGRAM=OFF
SET AUTOTICK=OFF, VCLASS = 200, VTICK = 25
DEFINE FILE SALES
SALES/D8.2=RETAIL_PRICE * UNIT_SOLD;
END
GRAPH FILE SALES
HEADING
"</6 <22 SAMPLE OF THE"
"<24 GRAPH DATE FACILITIES"
SUM SALES AND UNIT_SOLD ACROSS DATE
END

x
You can handle missing data selectively in GRAPH requests.
You can portray the missing data as null values, or choose to ignore
missing values and have the plot span the missing points. This applies
to requests containing both ACROSS and BY phrases, where the ACROSS
values are plotted across the horizontal axis.
Normally, missing values on the vertical axis are ignored (VZERO=OFF).
If ON, the values are treated as zero (0).
Instruct the system to ignore missing values through the SET
options, GMISSING and GMISSVAL, or you can set GPROMPT=ON, and select
the processing of the missing values when you execute your request.
These SET operations can be done once for your entire session, or
may be done on an individual basis to refine a particular request.
Keep in mind that they remain in effect until you reset the parameters
(see SET Parameters).
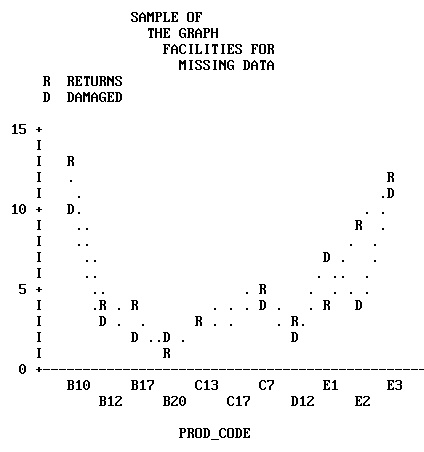
The examples that follow illustrate the same request, but with
different treatments of missing values selected. Run them as offline
requests:
SET GMISSING=ON, HIST=OFF
SET AUTOTICK=OFF, VCLASS=5, VTICK=1
GRAPH FILE SALES
HEADING
"</1 <22 SAMPLE OF"
"<24 THE GRAPH "
"<26 FACILITIES FOR"
"<28 MISSING DATA"
SUM RETURNS AND DAMAGED ACROSS PROD_CODE
END

In this example GMISSING is ON and GMISSVAL is 0, so the graph
ignores zero values for products C13 and C17.
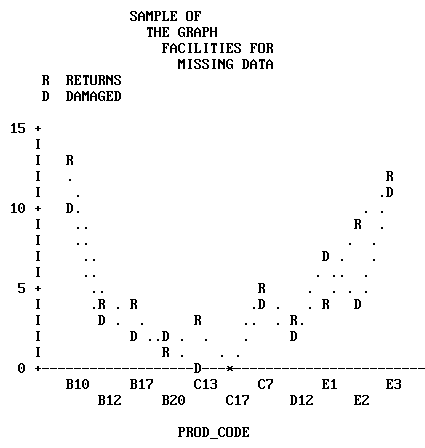
The graph below shows the effect of changing the GMISSING parameter
to OFF.
SET GMISSING=OFF
REPLOT

The values for products C13 and C17 were shown as positive values
with GMISSING ON. With GMISSING=OFF, the zero values for products
C13 and C17 are plotted on the graph.
x
When creating series of graphs it is often desirable
to have the same horizontal and vertical scales used for each graph
in the group. This situation arises whenever your graph request
combines an ACROSS phrase with a BY phrase.
In such requests the ACROSS values are plotted across the horizontal
axis, and a separate graph is created for each value of the BY field.
The default scales for the graphs vary depending on the range of
values for each verb object and BY field combination.
To apply the same scale to each graph, turn off the default scaling
mechanisms, and define your own minimum and maximum values for the
axis thresholds. See The Horizontal Axis: System Defaults, and How to Set the Scale: Assigning Fixed Limits.
xSaving Formatted GRAPH Output
You can place the output from GRAPH commands into specially
formatted SAVE files for subsequent conversion into printed or displayed
graphs. This capability, called deferred output, is useful for developing
graph requests on a device other than the one you use to produce
the final graph.
The facility described below is available for all ASCII graphics
devices that FOCUS supports, but is not available for the IBM 3279
color graphics terminal, which has a separate GDDM facility for
this purpose (see IBM Devices Using GDDM). In addition, deferred output cannot
be generated from a CONSOLE.
The syntax for the FOCUS facility is:
GRAPH FILE ...
SUM ...
.
.
.
ON {GRAPH|TABLE} SAVE [AS savename] FORMAT GRAPH
ON {GRAPH|TABLE} SET parameter value [, parameter value...]
END
where:
- ON GRAPH|ON TABLE
Denotes the command environment from which the request is
entered. This syntax suppresses display of the output and returns
a message that the file has been saved.
- SAVE|SET
Is the action taken.
- AS savename
Is an optional parameter that allows you to assign a permanent
file name as the target for the formatted output. The default is
FOCSAVE.
- parameter value
Is the system value you want to change or set. Any parameter
discussed in the Developing Applications manual can be set
or changed here. The syntax is essentially the same as ON TABLE
SET, which is discussed in Chapter 4, Sorting Tabular Reports.
- FORMAT GRAPH
Specifies that the output is to be formatted for whatever
graphics device is specified in the DEVICE parameter (see SET Parameters),
and saved in either the SAVE file or a file you name in an AS phrase.
As an alternative, you can display a graph on the CONSOLE before
creating a specially formatted SAVE file. To use this facility,
enter a GRAPH request to generate a display, as shown below:
GRAPH FILE ...
SUM ...
    .
    .
    .
END
After viewing the graph, use the following syntax to save the
graph for later output on another device:
SAVE [AS savename] FORMAT GRAPH
x
Syntax: How to Display Stored Graphs
To
display stored graphs, issue the appropriate form of the REPLOT
command from the output graphics DEVICE:
REPLOT [GRAPH|FROM] ddname
where:
- REPLOT [GRAPH|FROM]
-
Is the function to be performed.
-
ddname
-
Is the SAVE file name. This must be provided even if the
default FOCSAVE file was used.
Note:
- You need not
redefine the graphics device with another SET command. The device
specified through the DEVICE= parameter when the graph was saved
still applies.
- You can save
the internal matrix produced for a request and issue a REPLOT later in
the session if SAVEMATRIX is set to ON (see the Developing Applications manual).
You
can allocate the file yourself through the appropriate operating
system procedure, or you can let FOCUS allocate the SAVE file for
you dynamically. If you allow FOCUS to allocate the file, it allocates
a temporary file that you must rename if you wish to keep it after
you log off.
The record layout of the graphics SAVE file is
documented in Technical Memorandum #7704, Description of Deferred
Graphics Output (available through your Information Builders
Branch Office). You can process this file yourself if you have a
deferred graph system that accepts low-level terminal graphics commands.
xCreating Formatted Input for CA-TELLAGRAF
The Interface to CA-TELLAGRAF is a separate optional
interface product that you use to create formatted FOCUS output
files ready for processing by CA-TELLAGRAF, the publication-quality
graphics system produced by Computer Associates. With it, you can write
FOCUS GRAPH requests that generate files containing actual CA-TELLAGRAF commands
and all of the necessary data and control information for producing
graphs.
The data may originate in any FOCUS file or any file that FOCUS
can read (for example, QSAM, VSAM, ISAM, IMS, CA-IDMS/DB, ADABAS,
TOTAL, SQL, SYSTEM 2000, Model 204).
Directions for using the Interface can be found in the TELLAGRAF
Interface Users Manual.
xUsing the FOCUS ICU Interface
The FOCUS ICU Interface is a separate optional interface
product that you can use to generate graphs in conjunction with
IBM's Interactive Chart Utility.
ICU displays graphs and provides menu selections which allow
you to change such factors as graph type, size, and legend, and
to send the graph to a printer.
The ICU Interface can place you directly in the ICU environment
or can save the graph format and data for subsequent ICU processing.
When you leave ICU, control is returned to FOCUS.
All ICU graphics requests follow the standard FOCUS rules, and
each of the default graphs is represented by an ICU format file
distributed with FOCUS.
To use the ICU Interface, issue the command:
SET DEVICE = ICU
Subsequent GRAPH requests use ICU to generate graphs.
Directions for using this interface can be found in the ICU
Interface Users Manual.


