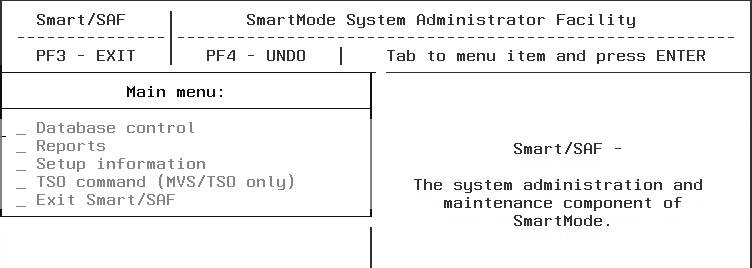
The Reports menu is available by selecting the Reports option from the Smart/SAF main menu. |
In this section: Monitored Samples Summary Report Monitor/Governor Status Report How to: |
To access the Reports, execute Smart/SAF from the FOCUS prompt:
EX SMARTSAF
The following window opens:
To display a report, perform the following steps:

If you select Online, the report will be displayed on the screen. If you select Offline, the report will be displayed on the screen as well as printed, that is, queued to the default printer.
When you view a report, you can use the PF7 and PF8 keys to scroll up and down through the report. When you are finished viewing a report, press Enter to return to the Reports menu.
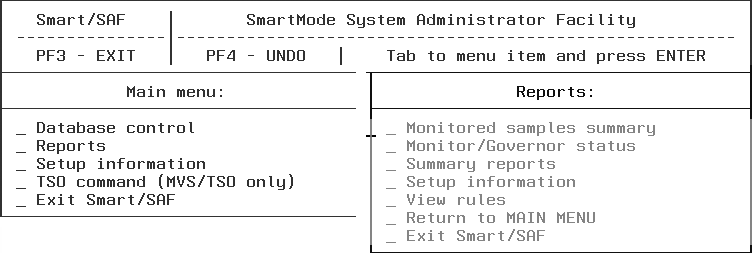
The following table summarizes the options available from the Reports menu:
Report Name |
Description |
Monitored samples summary |
Shows the first and last sample log dates for each database. For more information, see Monitored Samples Summary Report. |
Monitor/Governor status |
Indicates the status of usage monitoring and governing activity for each database under SmartMode's control. For more information, see Monitor/Governor Status Report. |
Summary reports |
Shows resource costs recorded for each request based on user ID, FOCEXEC, or canceled request. For more information, see Summary Reports. |
Setup information |
Indicates the status of the administrative and database setup information. For more information, see Setup Information Report. |
View rules |
Shows the rules that the Governor is using for the database you select. These include cost estimation, system administration, and custom rules. For more information, see View Rules Report. |
The following sections describe these reports in more detail.
The Monitored Samples summary report shows the databases from which request data has been logged, the first and last dates of the requests logged, and the number of records. This takes into account only the requests made when usage monitoring is turned on, for each database under SmartMode's control.

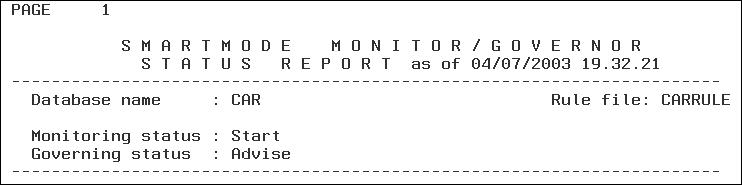
The SmartMode Monitor/Governor status report shows the current state of governing and usage monitoring for all databases under SmartMode's control.
The Summary reports show the resources of requests to the selected database during the time period you specify. It helps you determine where to set thresholds and provides information about potential savings, canceled requests, and database usage. You can run the report for all monitored databases, or for a specific database. If you specify a single database name, you must also specify the source (Master or relational database type). |
Example: |
When you select Summary Reports from the Reports menu, the Summary reports menu appears:

Select any or all of the reports by typing an X next to them. At the bottom of the screen, type an X to see the reports for all database requests or enter a single database name for which to see the reports. After you make your selections on this menu, the Monitored data window screen appears:
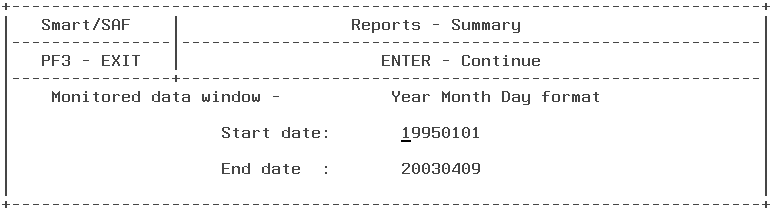
This screen allows you to specify the period you want the report to cover. The default start date is the date that usage monitoring began and the default end date is the last date of usage monitoring. Enter the month, day, and year as appropriate. Press the Enter key to continue and execute the report(s) you selected.
The following sections describe the different types of Summary reports.
The Monitored Queries report displays the actual resources used against the monitored databases in a particular procedure.

Governed Queries report lists the requests and indicates whether they were canceled, or whether Advise indicates they would be cancelled, either for all databases or for a single database that you specify. The following example shows the Governed Queries for the database CAR:

The Summary report sorted by user ID shows the average resources for requests that have been run against the specified database. The following example shows this report for the database CAR:

The Summary report by request name has the same fields as the fields on the Monitored queries report, but lists that information sorted by the request name:

The SmartMode Setup information reports display the current settings for all setup information, including global settings, thresholds, and shift schedules. |
Example: |
Select Setup information from the Reports menu. The following window opens:
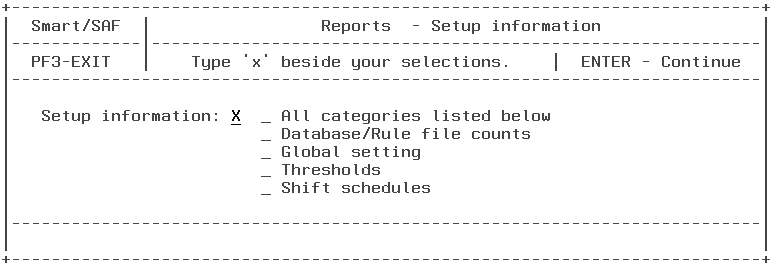
Select any or all of the reports by typing an X next to them and press Enter.
The following sections describe the Setup information reports.
The Database/Rule file counts report displays the number of databases being monitored and the number of rule files built by SmartMode.

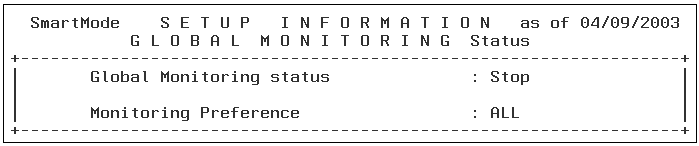
The Global setting reports displays the current Global Monitoring setting.
The Thresholds report displays the thresholds in effect for each shift.

The Shift Schedules schedule in effect for each shift.

The View rules report shows the rules that the Governor uses for each database.
When you select View Rules from the Reports menu, the following window opens:
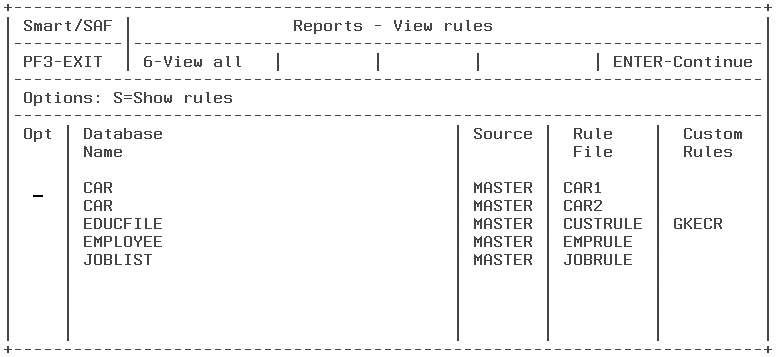
This screen lists the names of all databases with rule files. Type S in the Opt column to see the rules for a particular database (or next to several databases) and press Enter. Press PF6 to see the rules for every database.
The following is a part of the Rules report for the database JOBLIST:

After viewing the report, press Enter to return to the Reports menu.
| Information Builders |