Showing edatemp, foccache, and Other Internal Folders on the Application Tree
How to: |
An option has been added that enables Server Administrators to display the edahome, edaconf, edaprfu, scaroot, foccache and edatemp locations as folders for users on the Web Console Application Tree. Server Administrators have full access to these folders so that they can create and modify the files within them.
Procedure: How to Show the edatemp, foccache and Other Internal Folders on the Application Tree
- Select Applications from the main menu.
-
Click Applications Preferences from
the ribbon, or right-click the Application Directories folder
and select Applications Preferences.
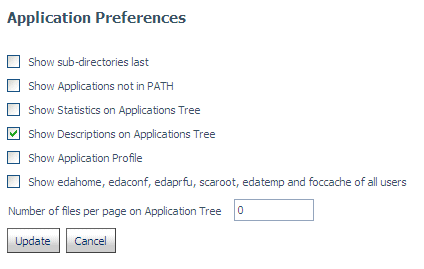
The Application Preferences pane opens, as shown in the following image.

- Select the Show edahome, edaconf, edaprfu, scaroot, edatemp and foccache of all users check box.
- Click Update.
The additional folders are added to the Application Directories folder.