In this section: |
The following new features apply to InfoAssist reports, charts, and documents.
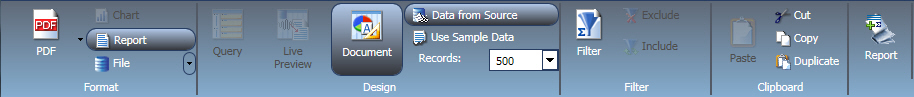
When working in Document Mode, in InfoAssist, a new group, Clipboard, has been added to the Home tab. Functions in this group enable you to cut, copy, paste, and duplicate items in your document. The Clipboard group is shown in the following image.
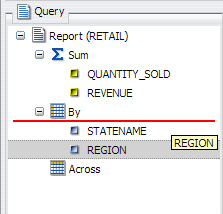
When clicking and dragging fields within the Query Design pane, a line indicator displays. The color of this line is determined by the theme.
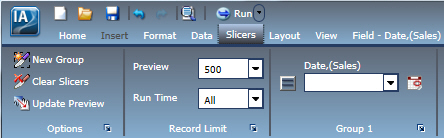
When working with full date fields while using Traffic Lights, Filtering, or Slicers, a calendar icon now displays. The calendar feature enables you to select a date using a calendar control. The calendar icon, as it displays for a Slicer on a date field, is shown in the following image.
Microsoft Excel 2007 output format has been added to the Chart and Document Modes in InfoAssist. This enables the Excel (xlsx) and Excel Formula (xlsx) formats in areas of InfoAssist where an output format can be selected.
Dynamic grouping allows you to create groups of elements based on the field data type that you select. Once you define a new group, a higher-level field is created that contains the selected elements. For example, in the WF_RETAIL database, there are a number of brands of televisions. Using the dynamic grouping functionality, you can create groups based on the popularity of a particular brand. The first group might include top sellers such as LG and Sony. The second group might contain the remaining brands (Panasonic, GPX, Supersonic, Tivax, and Audiovox). This would allow you to group top sellers into one group, and the remaining brands into another group.
Note: The Create Group option is only available for dimension fields of non-numeric format or attribute.
You can create a dynamic group using the Create Group option on the shortcut menu in the Query pane, as shown in the following image.
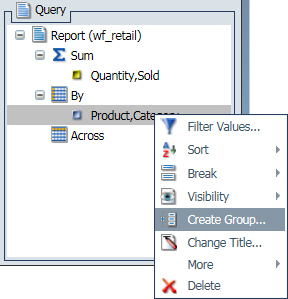
Note: You can also access the Create Group option from the shortcut menu in the Data pane.
When working with fields in the Query Design Pane, you can drag fields to rearrange the order in which they display in your report or chart. When you drag a field to a different location, an indicator line displays, as shown in the following image. This line provides guidance as to where the field will be placed.
You can use the field list search functionality to search for specific fields within a tree or list in the Resources panel. Searching occurs as you type in the Search fields box, which is located at the top of the Data pane, as shown in the following image.