Most TABLE requests can be converted into GRAPH requests by simply replacing the TABLE FILE command with the GRAPH FILE command. The only limitations are those inherent in the nature of the graph format. When a TABLE request is converted in this manner, the various phrases that make up the body of the request determine the format and layout of the graph. The type of graph produced by a GRAPH FILE request depends on the display command used (SUM or PRINT), and the sort phrase(s) used (ACROSS or BY).
The internal graph engine used by WebFOCUS has been integrated into the ReportCaster Distribution Server. This means that when the data for the GRAPH FILE request is sent back to the ReportCaster Distribution Server, it creates and distributes the graph. When using the GRAPH FILE command, you must include SET GRAPHEDIT=SERVER syntax to return data to the ReportCaster Distribution Server. Bursting is supported and is performed on the second BY field in the GRAPH FILE request. When creating the ReportCaster schedule, you must specify one of the graph image formats (GIF, PNG, or SVG).
You can use Graph Assistant to create a report that displays output as a pie graph:
SET LOOKGRAPH=PIE
SET GRAPHEDIT=SERVER
SET GRID=ON
SET BARNUM=ON
SET 3D=OFF
SET VERO=ON
GRAPH FILE CENTHR
SUM EMP_COUNT
ACROSS PLANT
ON GRAPH SET GRAPHSTYLE *
.....
.....
ENDSTYLE
ON GRAPH SET STYLE *
ENDSTYLE
END
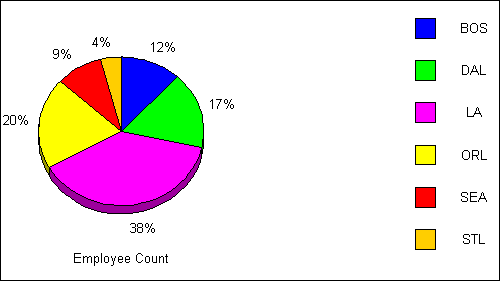
The following image shows an example of the type of multi-colored pie graph output that can be distributed by ReportCaster.

| WebFOCUS |