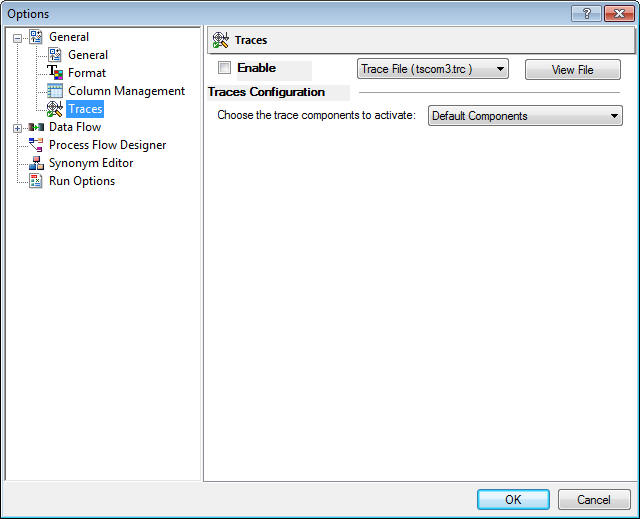
The Traces settings window is available on the Home tab, in the Tools group, by clicking Options.
The Traces settings window has the following options:
This setting enables you to perform tracing of the application to debug problems. You can choose the components activated in the trace files tscom3.trc and connection.trc. These trace files reflect the operations between the client and the server. You can view these trace files from the DMC.
Allows you to select where you will view the results of the trace. Options are Trace File or Console Log.
Click this button to view the trace file.
Allows you to specify which components will be traced.
| WebFOCUS |