Reports created in Interactive view or Query Design view have Excel output options in addition to Excel 2000, that are not available to charts and reports created in Document view.
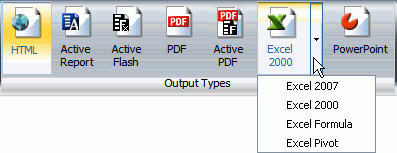
The additional options for the Excel format can be accessed through a drop-down menu on the Excel icon in the Output Types group of the Format tab when creating a report in Interactive view or Query Design view, as shown in the following image.
Note: The additional Excel output types can also be accessed through the Output Format button on the Status bar and the Format group on the Home tab. When you are creating a chart or are in Document view, Excel 2007, Excel 2000, Excel Formula, and Excel Pivot will be grayed out and inactive.
The Excel output types are explained in the following table.
|
Output Type |
Available in... |
Description |
|---|---|---|
|
Excel 2007 |
|
Outputs the report in Excel 2007 format. |
|
Excel 2000 |
|
Outputs the report in Excel 2000 format. |
|
Excel Formula |
|
Outputs the report in Excel with pivot table processing. |
|
Excel Pivot |
|
Outputs the report using native Excel formulas for totals and computed values. |
| WebFOCUS |