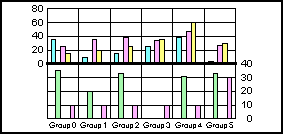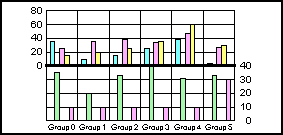
This property enables or disables the display of values that are out of range by clipping them to fit within the range. When this property is disabled (false), only values that fall directly between a given range are displayed.
Syntax:
setY2OffScaleDisplay(boolean);boolean = getY2OffScaleDisplay();where:
Can be one of the following:
true represents values less than or greater than a given range at the scale limit (minimum or maximum). For example, a value of 700 goes beyond the specified range of 250-500, so its bar would go all the way to the top of the graph. This value is the default.
false does not draw off scale values.
Example:
setDepthAngle(0);
setDepthRadius(0);
setLegendDisplay(false);
setGraphType(21);
setY2ScaleMaxAuto(false);
setY2ScaleMax(40.0);
setY2OffScaleDisplay(false);
setY2OffScaleDisplay(true);
See getDisplayOffScale(), setDisplayOffScale().
| WebFOCUS |