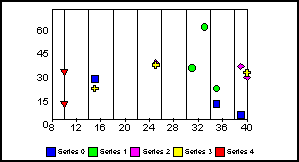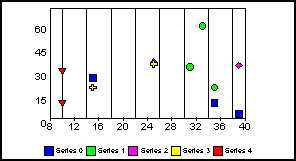
This property enables or disables the display of values that are out of range by clipping them to fit within the range.
Syntax:
setX1OffScaleDisplay(boolean);boolean = getX1OffScaleDisplay();where:
Can be one of the following:
true displays out-of-range values at scale limit (minimum or maximum). For example, a value of 700 goes beyond the specified range of 250-500, so its marker in a scatter graph would appear at the right edge of the graph. This value is the default.
false only displays values that fall within a given range. In the example above, the 700 marker would be omitted.
Example:
setMarkerSizeDefault(60);
setX1OffScaleDisplay(true);
setX1ScaleMaxAuto(false);
setX1ScaleMax(40.0);
setX1MajorGridStyle(4);
setGraphType(61);
setX1OffScaleDisplay(false);
See getDisplayOffScale(), setDisplayOffScale().
| WebFOCUS |