This property enables or disables drawing of the O1 axis line. The value assigned to O1AxisSide determines the location of the O1 axis line. The O1 axis line is typically displayed on the bottom of a vertical graph or on the left side of a horizontal graph. The O1AxisSide property may be used to change the location of the O1 axis line. Because the O1 axis base line is typically at the base or side of the graph frame, the line may not be visible even when this property is enabled. To make the O1 axis line wider and, therefore, more visible, use the getO1AxisLine() method to get the object ID of the line and the setLineWidth() method define the width of the line.
Syntax:
setO1AxisLineDisplay(boolean);boolean = getO1AxisLineDisplay();where:
Can be one of the following:
true draws O1-axis base line. This value is the default.
false does not draw O1-axis line.
Example:
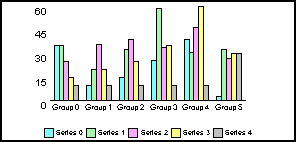
setDepthRadius(0);
setY1MajorGridDisplay(false);
setY1AxisLineDisplay(false);
setO1MajorGridDisplay(false);
setFrameDisplay(false);
setO1AxisLineDisplay(true);
setO1AxisLineDisplay(false);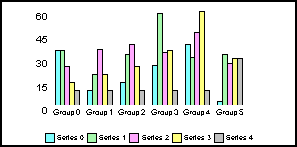
See O1AxisSide, O1LabelDisplay, getAxisSide(), getLineWidth().
| WebFOCUS |