Instead of defining each aggregation type and group by columns separately, you can call this function and enter the simplified aggregation syntax separated using BY.
data_grid_id.Saggregate("aggregation_type_prefix.column_name BY group_by_field",true,false);
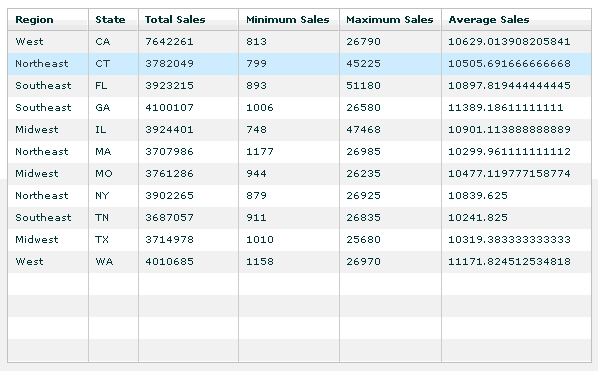
The following example illustrates how to use Saggregate function to create an aggregated DataGrid when creating applications using WebFOCUS Enable API.
<?xml version="1.0" encoding="utf-8"?>
<mx:Application xmlns:mx="http://www.adobe.com/2006/mxml" layout="absolute"
    creationComplete="initApp()" backgroundColor="#ffffff">
  <mx:Script>
    <![CDATA[
      import mx.charts.HitData;
      import mx.controls.Alert;
      import mx.collections.ArrayCollection;
      public var grid1:ibiObject = new ibiObject();
      public var fex:String="http://localhost:8080/ibi_apps/WFServlet
          ?IBIF_ex=ggsales&IBIAPP_app=ibiflexdemo";
      public function initApp():void
      {
        grid1.init(fex,dataReady);
      }
      public function dataReady(grid:ibiObject,obj:*):void
      {
        grid1.populateGrid(false);
        load_main1agg();
      }
      public function load_main1agg():void
      {
        grid1.Saggregate("Sum.DOLLARS,Average.DOLLARS,Min.DOLLARS,
              Max.DOLLARS BY ST,REGION",true,false);
        main1agg.dataProvider = grid1.prGridagg;
      }
    ]]>
  </mx:Script>
<mx:DataGrid x="30" y="30" width="585" id="main1agg" height="355">
<mx:columns>
<mx:DataGridColumn id="col1" headerText="Region"
dataField="REGION" width="80"/>
<mx:DataGridColumn id="col2" headerText="State" dataField="ST" width="50"/>
<mx:DataGridColumn id="col3" headerText="Total Sales"
dataField="Sum.DOLLARS"/>
<mx:DataGridColumn id="col4" headerText="Minimum Sales"
dataField="Min.DOLLARS"/>
<mx:DataGridColumn id="col5" headerText="Maximum Sales"
dataField="Max.DOLLARS"/>
<mx:DataGridColumn id="col6" headerText="Average Sales"
dataField="Average.DOLLARS" width="150"/>
</mx:columns>
</mx:DataGrid>
</mx:Application> The expected output is as follows.

| WebFOCUS |