The Stop Light is a high-level view of the objectives set for your strategy. It shows a summary of perspectives defined for your organization that illustrates how your objectives are performing. It also enables you to drill down to different dimension levels into detailed metrics that support each objective.
To run the Stop Light view, select Objective or Perspective from the Type drop-down list in the Analytics tab, select Stop Light from the View drop-down list and click Run.
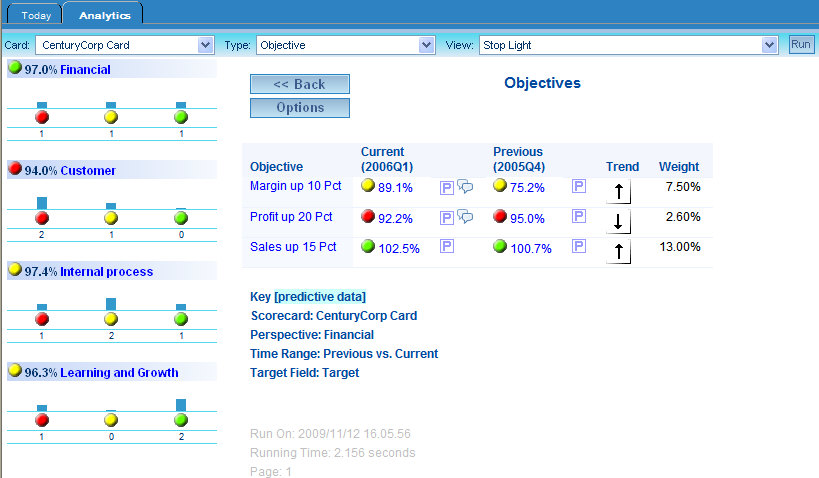
The Stop Light view, which displays the heading "Objectives" is divided into left and right sections. The left section shows perspectives configured for your default scorecard, which you can change by clicking a different perspective hyperlink. The right section shows details for one perspective, the Financial perspective, which is used for the examples in this chapter. In the right section, statistics for each objective are displayed in the Current, Previous, and Weight columns.
In the Objective column, drill-down hyperlinks provide options to display more detailed metrics in additional views. To display additional data related to an objective, click the Objective hyperlink and select the desired option. For a list of the available drill-down options, see Objective Drill-Down Options.
The following is an example of the Stop Light view.
The Options button, located at the top-left of most views, enables you to Print the view, Output (export) to an Excel file, Output to a PDF, or Schedule the run time and distribution of the view using the Report Wizard. You can also display alternate target data in the view by selecting Show Benchmark, Show Forecast, or Show Stretch Target. Additionally, on some views, there is an option to Show All related metrics for the data displayed on that view.
The Project ![]() icon
on this view and others enables you to display the projects aligned
to an objective or bring up the Feedback form for viewing, editing,
or adding feedback comments.
icon
on this view and others enables you to display the projects aligned
to an objective or bring up the Feedback form for viewing, editing,
or adding feedback comments.
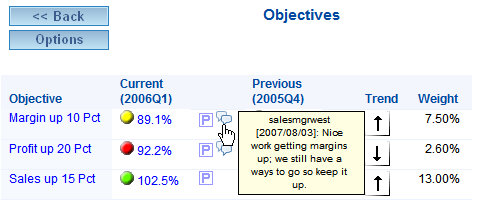
The feedback  icon
shown on this view and throughout PMF displays comments that have
been recorded for the objective on the Feedback form. If you hover
the mouse over the icon, the most recent feedback is displayed.
If you click the icon, you can drill down to a view where you can
read and edit the feedback.
icon
shown on this view and throughout PMF displays comments that have
been recorded for the objective on the Feedback form. If you hover
the mouse over the icon, the most recent feedback is displayed.
If you click the icon, you can drill down to a view where you can
read and edit the feedback.
If you see a red metric ![]() icon
on this or any other view, it indicates that a metric below the
icon is lower than the desired threshold, which is a sign of poor performance.
If you click the icon, you can quickly drill to a view of the metric.
icon
on this or any other view, it indicates that a metric below the
icon is lower than the desired threshold, which is a sign of poor performance.
If you click the icon, you can quickly drill to a view of the metric.
| WebFOCUS |