What Kinds of Formatting Can I Do?
There are many kinds of formatting
that you can apply to a report:
-
The appearance of the report data, such
as its font, size, style (italic, bold, or underlined), color (of
the foreground and the background), position, and justification.
You can also draw boxes or lines around data. You can use these properties
to emphasize critical values and to draw attention to important
data relationships.
You can also select which character to use
to mark decimal position, using either a period (.) or a comma (,),
to match the convention of the country in which the report will
be read. You can even choose which character to use to represent
a null value and missing data. For more information, see Formatting Report Data.
-
Providing context for data by "framing" it with
headings, footings, and customized column titles. You can include
fields and images within headings and footings. As with data, you
can specify a heading, footing, and column title font, size, style,
color, position, and justification, as well as enclose it within
boxes or lines. You can use these framing devices to explain the
context of the data and to engage the interest of the reader. For
more information, see Using Headings, Footings, Titles, and Labels.
-
Laying out the report on
the screen or printed page. You can choose the report margins, where
to place headings and footings, where to place background images
(watermarks), and how to arrange the report columns (adjusting the
space around and between columns, adjusting column width and column
order, and even stacking one column above another to reduce report
width). You can visually distinguish between different columns,
rows, or sort groups using color and lines. If you wish, you can
draw borders around parts of a report or around the entire report.
You
can lay out the report to optimize it for different display environments
such as screens of different sizes and resolutions, and printed
pages of different sizes. You can create multiple report panes on
a single page to print labels. You can even combine several reports
into a single file to display or print them as a group. For more information,
see Laying Out the Report Page.
-
Conditionally formatting a report
based on the report data. You specify a condition that, at run time,
is automatically evaluated for each instance of the report component
you specify, such as each value of a sort column. The formatting
option is applied to each instance of the report component for which
the condition is true. For example, in a sales report, you can draw
attention to sales staff who exceeded quota by making their names
bold and using a different color. For more information, see Controlling Report Formatting.
-
Choosing a display format, such as HTML (the default), PDF
(Adobe Acrobat Portable Document Format), Excel 2000, or PostScript,
to suit the viewing and processing needs of the readers. For more
information and a list of all the display formats available to you,
see Choosing a Display Format.
-
Making a report accessible to all users regardless
of their physical abilities, their browser type, or their screen
settings. For example, you can design a report fonts, colors, layout,
and other formatting to make it easier to read by audiences with
special vision needs, and provide text descriptions of tables and
graphics to make their information accessible to people who use
speech-based or Braille-based browsers. You can ensure that a report
conforms to any accessibility guidelines, such as Section 508 of
the U.S. Rehabilitation Act, to which the report is subject.
Example: Advantages of Formatting a Report
The following pair of reports show order
number, order date, and total order revenue for Century Corporation
in the third quarter of 2000. Compare the formatted version (on
the left) with the unformatted version (on the right):
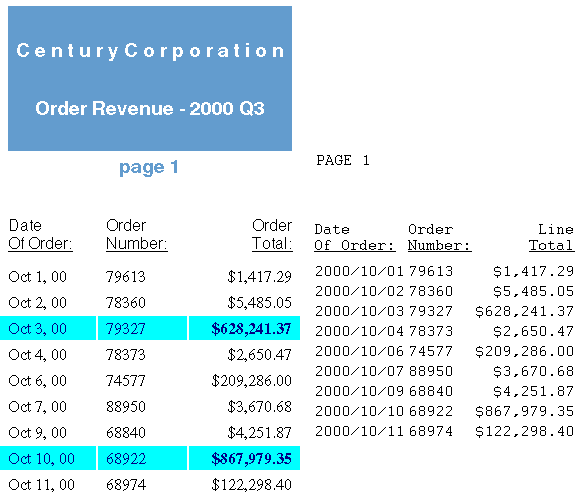
Consider how the formatting applied
to the version on the left:
-
Catches the interest of the reader with
a heading and use of color.
-
Makes the significance of the report clearer using
the heading, and by changing the last column title from the default
"Line Total" to "Order Total."
-
Makes the report easier and more appealing to read by
increasing the space between rows, by reformatting the order date,
and by using proportional fonts.
-
Draws the attention of the reader to important data. In
this case, to orders exceeding $500,000, by conditionally formatting
these rows with background color, font color, and (for the order
total) bold font style.