Performance Views

In this section:

The following topics describe and show details of the performance trending views available as drill-down options.

Percent Reached Histogram

When you click a drill-down hyperlink (for example, in the Show Measures view) and select Graph: Pct Reached Histogram, the drill down takes you to the Percent Reached Histogram, which contains graphical data for the associated objective and perspective, as shown in the following image. This view shows percentage reached performance trend data for the selected metric and associated time periods.
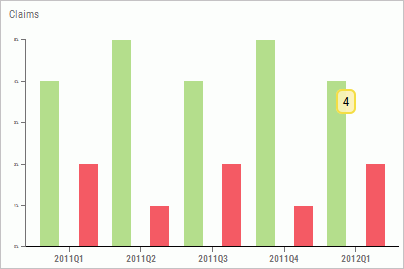
Percent Reached Histogram view

There are no additional drill downs available from this view.
Performance Trend

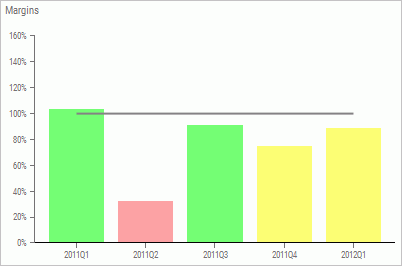
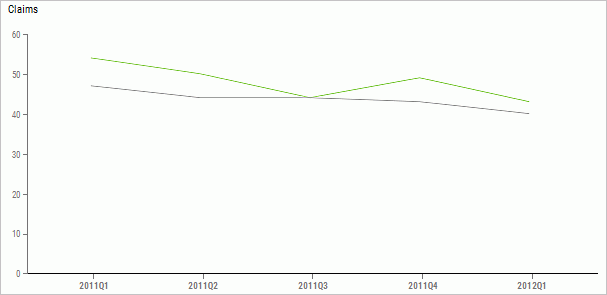
When you click a drill-down hyperlink for an objective, perspective, or measure, and select Graph: Performance Trend, the drill down takes you to the Performance Trend view, as shown in the following image. Depending on the metric, Performance Trend data is presented in one or more bar or line graphs.

Performance Trend view

There are no additional drill downs available from this view.
For information on selecting trend dates for Performance Trend views using the Analysis Designer, see Automatic Trend Dates.

Actual vs. Target Relationship

When you click a Measure drill-down hyperlink (for example, in the Show Measures view) and select Graph: Actual vs. Target Relationship, the drill down takes you to the Actual vs. Target Relationship view, as shown in the following image.

Actual vs Target view

This view tracks actual performance compared to target performance. The lines in the graph assume that the percent achievement of the target is shown. The actual targets can vary from period to period, depending on how they have been set up by planners or managers.

There are no additional drill downs available from this view.


WebFOCUS