|
|
|
Procedure: How to Draw the Strategy Map
Note: The first 3 steps apply only to new scorecards.
- In the Author page in PMF, click
the Strategy subtab to display the Strategy
Map.
The Strategy Map palette area located to the right of the Strategy Map tree. The palette area is blank when you first launch the Strategy Map, as shown in the following image.
- To begin
populating the Strategy Map, click Financial from the Perspectives tree on the left.
The Financial perspective is added to the palette area.
- To continue
populating the Strategy Map, click Customer, Internal Process, and
then Learning and Growth. These perspectives are also added
to the palette area.
If you want to change the order of the perspectives, increase or decrease the vertical size of a perspective, or remove a perspective, right-click a perspective in the palette area, and select the desired option in the pop-up menu that opens.
The following image shows the perspectives added to the Strategy Map and the available options when you right-click a perspective.
The options that are available when you right-click a perspective in the palette area include the following:
- Remove Perspective. Removes the perspective.
- Move Perspective Up. Moves the perspective up one level.
- Move Perspective Down. Moves the perspective down one level.
- Decrease Height. Decreases the height of the perspective area by 75 pixels (repeat as many times as needed).
- Increase Height. Increases the height of the perspective area by 75 pixels (repeat as many times as needed).
- To add
objectives to the Strategy Map, click the Objectives panel
button, expand the Objectives folder, and
then click the desired objective (for example, Customer
claims down).
The selected objective is added to the palette area as a rectangle-shaped label.
Note: The default rectangle-shaped objective label can be changed using the Edit Scorecard panel. For more information, see Editing, Deleting, and Creating Scorecards.
- Drag
the objective to the desired perspective in the Strategy Map and drop
it.
The objective is now anchored to the perspective (for example, Customer claims down is anchored to Customer). The following image shows the new objective and the options that are available when you right-click an objective label.
Note: If you were to save the Strategy Map now, then navigate to the Author page and check under the Customer perspective, you would find that the objective, Customer claims down, is now a child of that perspective.
If you want to start a link or remove an objective from the Strategy Map, right-click an objective in the palette area, and select the desired option from the pop-up menu that opens.
The options that are available when you right-click an objective label include the following:
- Start Link. The first step in linking two objectives.
- Remove Objective. Removes the objective from the palette area.
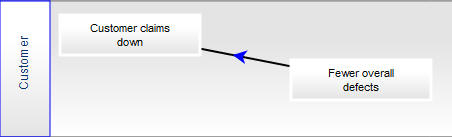
- Click the Fewer overall defects objective, and when it appears in the palette area, drag it to the Customer perspective to anchor it.
- Right-click Fewer overall defects and select Start Link from the pop-up menu.
- Click Customer
claims down to link the two objectives together, as
shown in the following image.
- Drag
more objectives over and link them to finish creating your Strategy Map.
Each link that you create between two objectives, represents the cause and effect relationship between those objectives. The network of links between all of your objectives is called a strategy in PMF.
- From the left pane of the window, click Save to save the Strategy Map.