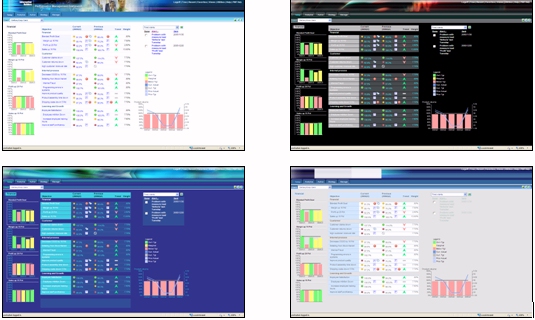
Administrators: Styling the Look and Feel of PMF
PMF supports a central style sheet model for all aspects
of views, reports, and the application User Interface. Using the
Look panel, you can use global settings to allow all views, gadgets,
and charts to be formatted as you desire. The global settings allow you
to select:
- A consistent color
scheme across all charts and chart gadgets. This allows for user-created
chart coloration.
- A global style sheet
default that formats views and grid gadgets. This allows for easier
user-created styling.
- An override font
for all reports.
PMF includes chart and graph styles that allow you to automatically
select a look for every chart and graph in the system (all content
that maps to a WebFOCUS graph from PMF content). All charts in the
system are written to allow template styling. You can also define custom
charting color schemes using the Look panel.
A section of the Look settings control the look and style of
the user interface through different indicators, HTML style sheets,
graph palettes, and WebFOCUS StyleSheet settings.

You can create new skins to follow any corporate standards without
adversely affecting the operation of PMF.
Note: For more information on the default settings you
can view and change on the Look panel, see Look Settings.
x
The PMF style swatching system allows you to generate
a color swatch for PMF, WebFOCUS content, and the WebFOCUS BI Portal,
that give a consistent style to match the official style of your
organization or your group preferences.
The swatch file can come from using the WebFOCUS Branding portal,
or you can design your own styling in a few moments with the PMF
dynamic styling panel. Once you have a style designed, you can apply
it across an entire PMF tenant in seconds. PMF picks up the new
style and applies it across the entire system.
Note:
- If you are in a multi-tenant or cloud version of PMF, the
color look for PMF is tenant-specific. You can easily move the styling
from tenant to tenant, since it is controlled by a compact text
file.
- The PMF legacy look management system that uses manually-configured
CSS files and FOCUS style sheets is deprecated. In PMF Release 8,
all 11 standard style sheets that shipped with PMF have equivalent
swatches that you can use.
x
Procedure: How to Use the Swatching System to Change the PMF Look
To change
the look of PMF, using the swatching system:
-
In the Manage tab, click the Settings panel
button.
-
Click the Look panel button.
The Look settings panel opens.
-
You can either set the new colors directly in the Background
and Foreground colors fields, or select a swatch (LESS) file from
the Choose a swatch drop-down menu.
The Look settings panel has the following options:
-
Choose a swatch drop-down menu:
-
Template swatches. Swatches
that ship with PMF. You can click Save As and rename the swatch,
but you cannot override their settings without changing the file
name.
-
Tenant swatches. Swatches that you or another user with administrator
privileges created for use in PMF. Clicking Save or Save As will
save the swatch file to the local area for your tenant.
-
Background colors. Refer to HTML backgrounds, such as
those for panels, grids, and dashboards.
-
Foreground colors. Refer to text and borders.
-
Click Preview once you have finished
making your selections.
A confirmation box opens.
You can save the current
state of the swatch as you are editing it by clicking Save.
You can save the current settings under a new name by clicking Save
As.
-
Click Apply to apply the swatch
and reformat the PMF colors. If you want to cancel the operation,
click Revert.
Note:
- After applying a new swatch to
PMF, you should refresh the portal pages to remove the old style
sheets and display the new colors.
- If you created a tenant swatch, its LESS file is automatically
included in any snapshots.
For
more information on the swatching system, see Look Settings.
x
Procedure: How to Disable or Enable Chart Gradients
You
can control whether PMF applies a color gradient to charts. Disabling
the gradients allows you to apply a flat look to charts.
To
disable or enable chart gradients:
-
In the Manage tab, click the Settings panel
button.
-
Click the Look panel button.
The Look settings panel opens.
-
Click the Advanced tab.
-
From the drop-down menu, select:
-
Y. Enable gradients on charts.
-
N. Disable gradients on charts.
-
Click Save Advanced.

