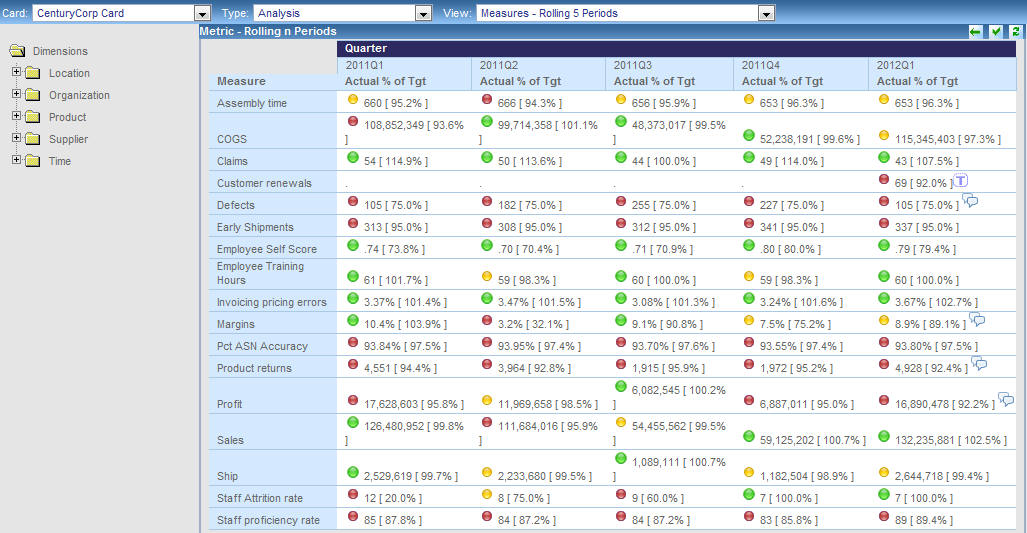
The Rolling 5 Periods view displays the current period and four previous periods worth of achievement for all metrics to which you currently have access. Metrics are automatically aggregated. The view rolls across time, so the last five periods are always sensitive to the current date.
To run the Rolling 5 Periods view, select Analysis or Measures Detail in the Type drop-down menu of the Analytics tab, then select Measures - Rolling 5 Periods from the View drop-down menu and click Run.
The following is an example of the Rolling 5 Periods view, which displays the heading Metric - Rolling n Periods.

The navigation tree on the left permits you to drill down and analyze measures at the lowest dimensional level. The view automatically reformats itself appropriately, depending on the level of dimensionality you select. For example, if you drill into the Time dimension and choose the current period, the previous periods are automatically omitted from the view. If you choose only the current year, only periods that fall into this year are displayed.
The view also provides the ability to drill into the properties for any item in the Measure column to display additional views that show how the measure was loaded, what calculations were used to create it, and so on. To display additional data related to a measure, click a hyperlinked item in the Measure column and select the desired option. For a list of the available drill-down options, see Measure Drill-Down Options.
| WebFOCUS |