 icon next to Connectivity - At
a Glance, as shown in the following image.
icon next to Connectivity - At
a Glance, as shown in the following image.When monitoring large number of servers with many applications, it is important to recognize an overall health of the enterprise being monitored. As health is a relative term and can have various meanings to different applications or users, a Health Model has been developed which can be manipulated to fit the monitoring needs.
The SPOG for Sentinel displays a health status for each Server based on various factors including service response times, message processing rate, error rates and others to calculate the health score based on a Health Model. Based on the calculated health score, the state of the health is assigned.
Health score is calculated based on the following formula:
score = -0.25 * rt + 1 * tp + 2 * mtp + -20 * ec + 0.5 * ac + 0.5 * cc + -0.5 * qc
There are four available states which are then assigned as overall health of the server:
score > µ + o, then health is EXCELLENT
score < µ - o, then health is POOR
score < µ - o * 2, then health is SEVERE
else health is AVERAGE;
where:
Is the statistical mean.
Is the standard deviation.
Is the response time.
Note: rt only applies to server and does not factor in propagation delay.
Is the throughput.
Is the maximum throughput.
Is the error count.
Is the active count.
Is the completed count.
Is the queued count.
The Health model is designed to be adjusted for the specific application monitoring needs and can be configured to change the weights. For more information, see Sentinel Configuration Properties.
To access the Health-At a Glance view, click on the icon next to Connectivity - At
a Glance, as shown in the following image.

This Health - At a Glance view is displayed, as shown in the following image.
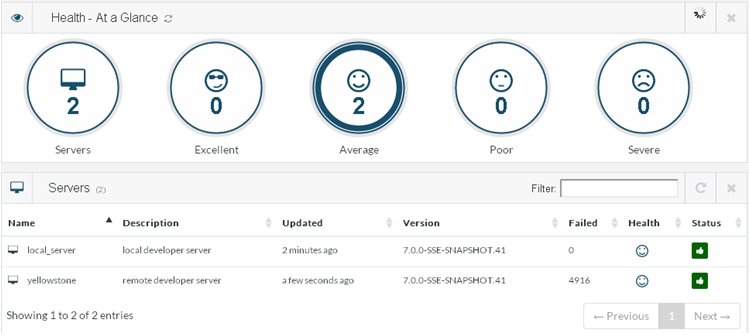
The health of the servers is shown in the bubble dashboard, as well as within the Health column for each server.
| iWay Software |