iWay Data Profiler (iDP) is a tool for business users that is designed as a Web 2.0 application leveraging the Profiler functionality in iWay Data Quality Server (iWay DQS) and the strength of WebFOCUS business intelligence capabilities.
iDP generates eye catching active reports using the latest business intelligence technology, including Adobe PDF and Adobe Flex, for easy analysis of key business data by integrating output from iWay DQC. In addition, iDP supports the iOS mobile operating system (iPad®, iPhone, or iPod touch®).
It allows business users to view, analyze, distribute, and monitor how much of their data follows the rules defined by their company. iDP also enables steady improvement in data quality towards following defined business rules and standards. In addition, iDP also allows a company to generate a Data Quality Assurance report.
The iDP Security Center allows administrators to limit access to iDP by creating, editing, and deleting groups, users, folders, and their roles.
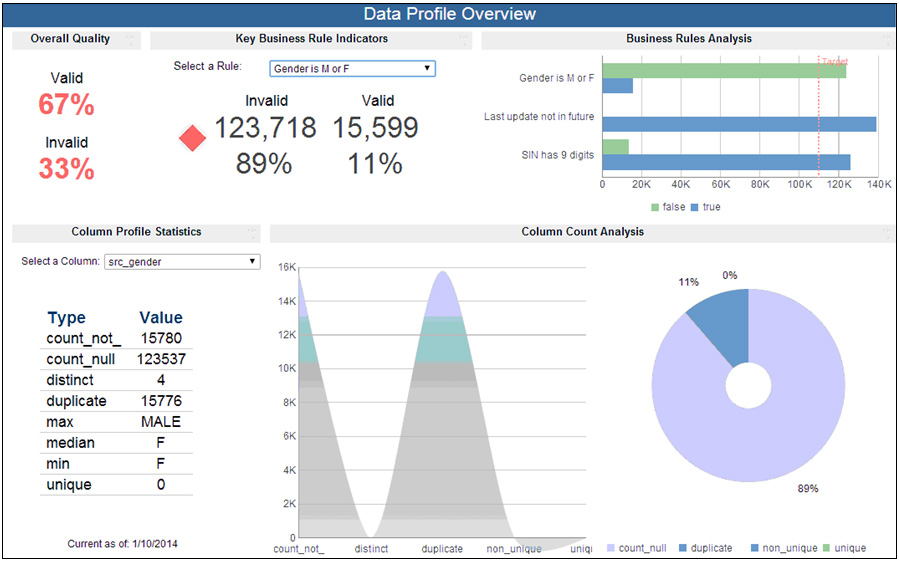
The following image shows a data profile generated in a dashboard framework. In this example, the count, frequency, and percentage of duplicate, non-unique, and unique data based on a selected business rule is being evaluated. Several graphical charts are used as visual aids to represent the data profile.
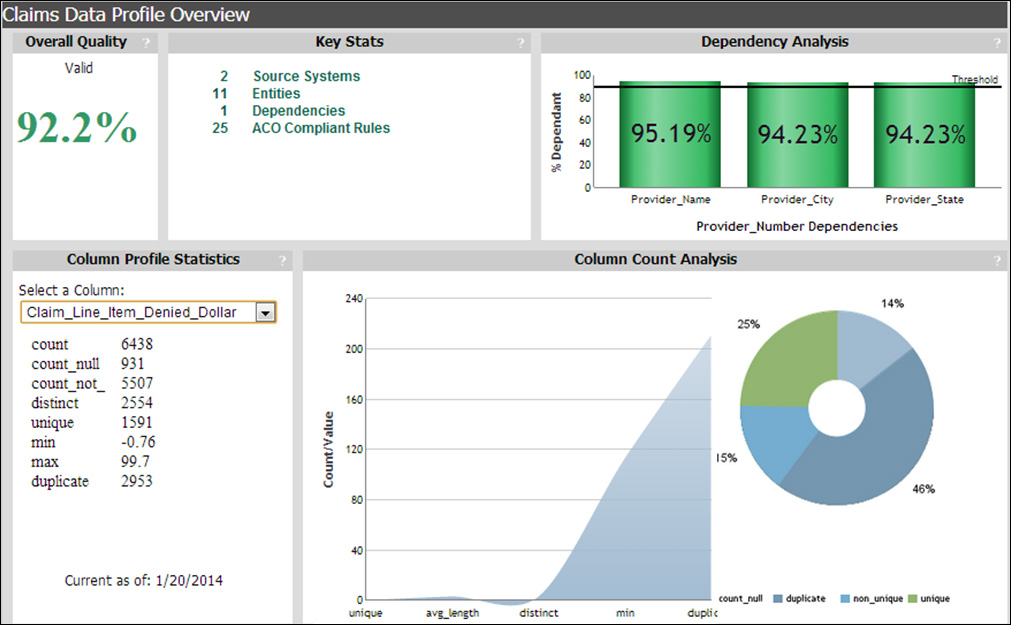
The following image shows another data profile generated in a dashboard framework, where the overall data quality is also calculated. Several graphical charts are used as visual aids to represent the data profile.
Key features and advantages that are provided through iWay Data Profiler (iDP) include:
- A browser-driven, thin-client solution, iDP allows you to extend powerful data profiling capabilities to anyone who needs them without any additional client software, plug-ins, or report viewers.
- Collecting profiling data easily and directly from iWay DQS through seamless integration.
- Tagging and archive profiling data input as a set into an associated RDBMS for easy retrieval.
- Viewing the data profiling set using advanced data manipulation and graphics.
- Comparing multiple archived data profiling sets to view the variance in profiling data.
- Printing and exporting any of the supported views in industry-standard formats, such as HTML, PDF, and Excel.
- Sharing data with other users across the intranet or Internet.
Using the latest market technology for Web 2.0 BI dashboards, reports, and charts, iDP leads to a steady improvement in data quality, following business rules and standards.
iDP is built mainly for analysis of data. It provides insight into the quality of data and aids in the identification of data quality issues.
The following table lists and describes the documentation for iWay Data Profiler (iDP) that is currently available on the iWay Technical Library:
|
Documentation Title |
Description |
|---|---|
|
This documentation is intended for users who are required to install iWay Data Profiler (iDP). Prerequisite information for iDP is also provided. |
|
|
This documentation serves as a getting started guide for iDP. It introduces and describes the key features and functionality of the various iDP facilities. In addition, the basic menus and options that are found in the user interface and layout of iDP are described. |
|
|
This documentation describes how to use iDP in conjunction with iWay Data Quality Server (DQS), to analyze data using defined data rules, view data using dashboards, and generate reports. |