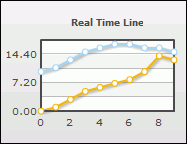
A line chart reveals the movement or trend of numerical data over time. A real-time line chart is shown in the following image.

This API call creates a real-time line chart:
iwenable.RealTimeLine(ctxt,id,debug,atts)
Parameter | Type | Required/ Optional | Description |
|---|---|---|---|
ctxt | String | Required | Specifies the context of the iWay Service Manager. |
id | String | Required | Specifies the ID of the HTML element that will be rendered. |
debug | Integer | Optional | Specifies whether or not to debug the real-time line chart. |
atts | Object | Optional | Configures the iWay Enable real-time line chart. |
Inherited operation:
render()
| iWay Software |