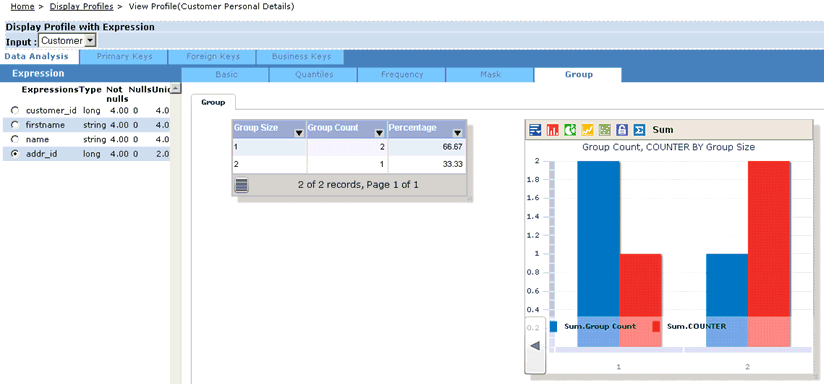
Select the Group tab under the Data Analysis tab in the Display Profiles screen, as shown in the following image.

The Groups tab presents a different analysis of the data in the Frequency tab. It shows the number of times that each non-null frequency count is repeated. If all values are unique, the group size will be 1, as there are no duplicate values. Each time a value is repeated, it forms a new group.
Similar values come under a single group. Group size specifies the number of times the same value is repeated. Group count specifies how many such groups exist. Percentage is calculated from group count.
| iWay Software |