Você pode distribuir uma imagem de gráfico em um relatório PDF utilizando o ReportCaster através da execução dos seguintes passos:
Quando você habilita a opção de gráfico JSCOM3 no seu Servidor de Relatório do WebFOCUS, não é necessário definir o GRAPHSERVURL, por exemplo:
SET GRAPHSERVURL=http://hostname:port/ibi_apps/IBIGraphServletPara configurações que não devem ser utilizadas com o GRAPHSERVURL, consulte o manual Segurança e Administração do WebFOCUS.
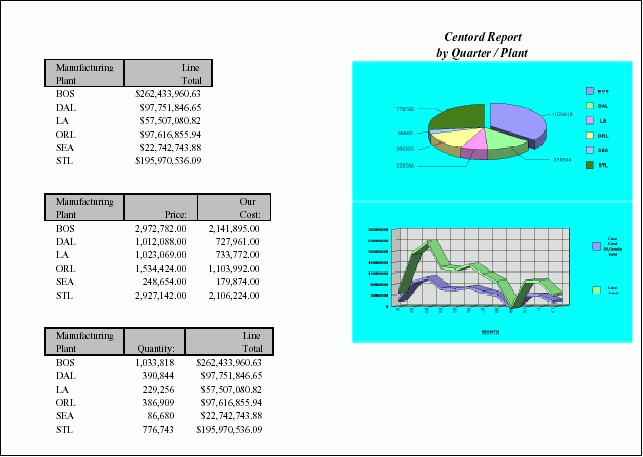
A imagem a seguir mostra um documento PDF composto que contém três relatórios e inclui duas imagens GIF dentro de um dos relatórios.

O código a seguir cria o documento PDF composto ilustrado na imagem anterior. Para obter este procedimento, acesse:
http://techsupport.informationbuilders.com/tech/wbf/wbf_tcn_088.html
SET GRAPHSERVURL=http://hostname:port/ibi_apps/IBIGraphServlet
-* where hostname:port is the host name and port number of your
-* Application Server
GRAPH FILE CENTORD
SUM QUANTITY AS ''
ACROSS PLANT
ON GRAPH SET LOOKGRAPH PIESINGL
ON GRAPH SET GRAPHEDIT SERVER
ON GRAPH SET GRAPHSTYLE *
setPieDepth(99);
setPieTilt(57);
setAutofit(getLegendText(0),false);
setFontSize(getLegendText(0),14);
setAutofit(getLegendText(1),false);
setFontSize(getLegendText(1),14);
setAutofit(getLegendText(2),false);
setFontSize(getLegendText(2),14);
setAutofit(getLegendText(3),false);
setFontSize(getLegendText(3),14);
setAutofit(getLegendText(4),false);
setFontSize(getLegendText(4),14);
setAutofit(getLegendText(5),false);
setFontSize(getLegendText(5),14);
setFontSizeAbsolute(getPieSliceLabel(),true);
setAutofit(getPieSliceLabel(),false);
setFontSize(getPieSliceLabel(),14);
setFontStyle(getLegendText(0),2);
setBorderColor(getX1MinorGrid(),new Color(133,133,133));
setBorderColor(getY1MinorGrid(),new Color(133,133,133));
setAutofit(getLegendText(0),false);
setFillColor(getChartBackground(),new Color(0,255,255));
setPieSliceDetach(getSeries(0),52);
setFontSizeAbsolute(getO1Label(0),true);
setAutofit(getO1Label(0),false);
setFontSize(getO1Label(0),12);
setMarkerDisplay(true);
setConnectLineMarkers(false);
setConnectScatterMarkers(false);
setO1LabelDisplay(true);
setO1AxisSide(0);
setO1MajorGridDisplay(true);
setO1MajorGridStyle(0);
setO1MinorGridDisplay(false);
setSeriesType(0,0);
setY1LabelDisplay(true);
setY1AxisSide(0);
setY1MajorGridDisplay(true);
setY1MajorGridStyle(0);
setY1MinorGridDisplay(false);
setPieFeelerTextDisplay(1);
setPieLabelDisplay(0);
setTextFormatPreset(getPieSliceLabel(),1);
setTextFormatPreset(getY1Label(),1);
setLegendDisplay(true);
setFontSizeAbsolute(getLegendText(),true);
ENDSTYLE
ON GRAPH SET BARNUMB OFF
ON GRAPH SET 3D OFF
ON GRAPH SET VZERO ON
ON GRAPH SET GRID ON
ON GRAPH SAVE AS GRAPH1 FORMAT GIF
END
GRAPH FILE CENTORD
SUM LINE_COGS LINEPRICE
ACROSS MONTH
ON GRAPH SET LOOKGRAPH VLINSTK
ON GRAPH SET GRAPHEDIT SERVER
ON GRAPH SET GRAPHSTYLE *
setGridStep(getY1MajorGrid(),1.0E8);
setGridStep(getY2MajorGrid(),4.0E7);
setTextWrap(getLegendText(0),true);
setDisplayBarAsPictograph(true);
setAutofit(getLegendText(0),false);
setFontSize(getLegendText(0),11);
setAutofit(getLegendText(1),false);
setFontSize(getLegendText(1),11);
setAutofit(getY1Label(),false);
setFontStyle(getLegendText(0),2);
setBorderColor(getX1MinorGrid(),new Color(133,133,133));
setBorderColor(getY1MinorGrid(),new Color(133,133,133));
setRect(getLegendArea(),new Rectangle(10901,-9500,4698,20800));
setAutofit(getLegendText(0),false);
setDataLineThickness(39);
setDepthAngle(19);
setDepthRadius(18);
setFillColor(getChartBackground(),new Color(0,255,255));
setFillColor(getFrame(),new Color(223,223,223));
setFillColor(getFrameSide(),new Color(191,191,191));
setFillColor(getFrameBottom(),new Color(179,179,179));
setRiserBarGroupSpacing(52);
setRiserWidth(31);
setScaleMax(getY1Axis(),5.0E8);
setScaleMax(getY2Axis(),2.8E8);
setScaleMin(getY2Axis(),0.0);
setSeriesType(getSeries(0),2);
setSeriesType(getSeries(1),2);
setFontSizeAbsolute(getO1Label(0),true);
setAutofit(getO1Label(0),false);
setFontSize(getO1Label(0),12);
setFontSizeAbsolute(getO1Label(1),true);
setAutofit(getO1Label(1),false);
setFontSize(getO1Label(1),12);
setFontSizeAbsolute(getO1Label(2),true);
setAutofit(getO1Label(2),false);
setFontSize(getO1Label(2),12);
setFontSizeAbsolute(getO1Label(3),true);
setAutofit(getO1Label(3),false);
setFontSize(getO1Label(3),12);
setFontSizeAbsolute(getO1Label(4),true);
setAutofit(getO1Label(4),false);
setFontSize(getO1Label(4),12);
setFontSizeAbsolute(getO1Label(5),true);
setAutofit(getO1Label(5),false);
setFontSize(getO1Label(5),12);
setFontSizeAbsolute(getO1Label(6),true);
setAutofit(getO1Label(6),false);
setFontSize(getO1Label(6),12);
setFontSizeAbsolute(getO1Label(7),true);
setAutofit(getO1Label(7),false);
setFontSize(getO1Label(7),12);
setFontSizeAbsolute(getO1Label(8),true);
setAutofit(getO1Label(8),false);
setFontSize(getO1Label(8),12);
setFontSizeAbsolute(getO1Label(9),true);
setAutofit(getO1Label(9),false);
setFontSize(getO1Label(9),12);
setFontSizeAbsolute(getO1Label(10),true);
setAutofit(getO1Label(10),false);
setFontSize(getO1Label(10),12);
setFontSizeAbsolute(getO1Label(11),true);
setAutofit(getO1Label(11),false);
setFontSize(getO1Label(11),12);
setMarkerDisplay(false);
setConnectLineMarkers(true);
setConnectScatterMarkers(true);
setO1LabelDisplay(true);
setO1AxisSide(0);
setO1MajorGridDisplay(true);
setO1MajorGridStyle(0);
setO1MinorGridDisplay(false);
setSeriesType(0,2);
setSeriesType(1,2);
setY1LabelDisplay(true);
setY1AxisSide(0);
setY1MajorGridDisplay(true);
setY1MajorGridStyle(0);
setY1MinorGridDisplay(false);
setPieFeelerTextDisplay(0);
setTextFormatPreset(getPieSliceLabel(),1);
setTextFormatPreset(getY1Label(),1);
setLegendDisplay(true);
setFontSizeAbsolute(getLegendText(),true);
setFontSizeAbsolute(getY1Label(),true);
setFontSize(getY1Label(),11);
setFontStyle(getY1Label(),2);
ENDSTYLE
ON GRAPH SET BARNUMB OFF
ON GRAPH SET 3D ON
ON GRAPH SET VZERO ON
ON GRAPH SET GRID ON
ON GRAPH SAVE AS GRAPH2 FORMAT GIF
END
SET COMPOUND  = OPEN NOBREAK
TABLE FILE CENTORD
SUM
     LINEPRICE
BY
     PLANT
HEADING
" <40 "
"Centord Report "
"by Quarter / Plant "
ON TABLE SET PAGE-NUM OFF
ON TABLE SET BYDISPLAY OFF
ON TABLE NOTOTAL
ON TABLE SET ONLINE-FMT PDF
ON TABLE SET STYLE *
UNITS=IN,
PAGESIZE='Letter',
LEFTMARGIN=0.500000,
RIGHTMARGIN=0.500000,
TOPMARGIN=0.000000,
BOTTOMMARGIN=0.000000,
SQUEEZE=ON,
ORIENTATION=LANDSCAPE,
$TYPE=REPORT,
FONT='TIMES NEW ROMAN',
SIZE=8,
COLOR=BLACK,
BACKCOLOR=NONE,
STYLE=NORMAL,
$TYPE=TITLE,
GRID=ON,
BACKCOLOR=SILVER,
$TYPE=REPORT,
IMAGE=GRAPH1.gif,
POSITION=(4.000000 0.700000),
SIZE=(3.200000 1.600000),
$TYPE=REPORT,
IMAGE=GRAPH2.gif,
POSITION=(4.000000 2.300000),
SIZE=(3.200000 1.600000),
$TYPE=HEADING, LINE=2, SIZE=10,STYLE=BOLD+ITALIC, JUSTIFY=CENTER, $ TYPE=HEADING, LINE=3, SIZE=10,STYLE=BOLD+ITALIC, JUSTIFY=CENTER, $ ENDSTYLE END
SET COMPOUND = NOBREAK
TABLE FILE CENTORD
SUM PRICE COST
BY
PLANT
ON TABLE SET PAGE-NUM OFF
ON TABLE SET BYDISPLAY OFF
ON TABLE NOTOTAL
ON TABLE SET ONLINE-FMT PDF
ON TABLE SET STYLE *
     UNITS=IN,
     PAGESIZE='Letter',
     LEFTMARGIN=0.500000,
     RIGHTMARGIN=0.500000,
     TOPMARGIN=0.000000,
     BOTTOMMARGIN=0.000000,
     SQUEEZE=ON,
     ORIENTATION=LANDSCAPE,
$
TYPE=REPORT,
FONT='TIMES NEW ROMAN',
SIZE=8,
COLOR=BLACK,
BACKCOLOR=NONE,
STYLE=NORMAL,
$TYPE=TITLE, BACKCOLOR=SILVER,
GRID=ON,$
ENDSTYLE
END
SET COMPOUND = CLOSE
TABLE FILE CENTORD
SUM
QUANTITY
LINEPRICE
BY
PLANT
ON TABLE SET PAGE-NUM OFF
ON TABLE SET BYDISPLAY OFF
ON TABLE NOTOTAL
ON TABLE SET ONLINE-FMT PDF
ON TABLE SET STYLE *
UNITS=IN,
PAGESIZE='Letter',
LEFTMARGIN=0.500000,
RIGHTMARGIN=0.500000,
TOPMARGIN=0.000000,
BOTTOMMARGIN=0.000000,
SQUEEZE=ON,
ORIENTATION=LANDSCAPE,
$TYPE=REPORT,
FONT='TIMES NEW ROMAN',
SIZE=8,
COLOR=BLACK,
BACKCOLOR=NONE,
STYLE=NORMAL,
$
TYPE=TITLE, BACKCOLOR=SILVER,
GRID=ON,$
ENDSTYLE
END| WebFOCUS |