Puede distribuir una imagen de gráfico en un informe PDF con ReportCaster siguiendo los pasos que se muestran a continuación:
Al habilitar la opción de gráficos JSCOM3 en su servidor de informes WebFOCUS, no es necesario establecer GRAPHSERVURL; por ejemplo:
SET GRAPHSERVURL=http://hostname:port/ibi_apps/IBIGraphServletPara ver las configuraciones que pueden utilizarse con GRAPHSERVURL, consulte el manual Seguridad y administración de WebFOCUS.
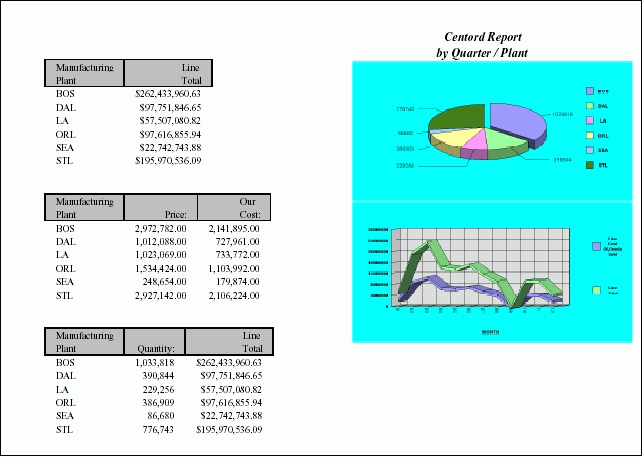
La siguiente imagen muestra un documento compuesto que contiene tres informes e incluye dos imágenes GIF en uno de los informes PDF.

El siguiente código crea el documento complejo PDF que se muestra en la imagen previa. Para recuperar este procedimiento, visite:
http://techsupport.informationbuilders.com/tech/wbf/wbf_tcn_088.html
SET GRAPHSERVURL=http://hostname:port/ibi_apps/IBIGraphServlet
-* where hostname:port is the host name and port number of your
-* Application Server
GRAPH FILE CENTORD
SUM QUANTITY AS ''
ACROSS PLANT
ON GRAPH SET LOOKGRAPH PIESINGL
ON GRAPH SET GRAPHEDIT SERVER
ON GRAPH SET GRAPHSTYLE *
setPieDepth(99);
setPieTilt(57);
setAutofit(getLegendText(0),false);
setFontSize(getLegendText(0),14);
setAutofit(getLegendText(1),false);
setFontSize(getLegendText(1),14);
setAutofit(getLegendText(2),false);
setFontSize(getLegendText(2),14);
setAutofit(getLegendText(3),false);
setFontSize(getLegendText(3),14);
setAutofit(getLegendText(4),false);
setFontSize(getLegendText(4),14);
setAutofit(getLegendText(5),false);
setFontSize(getLegendText(5),14);
setFontSizeAbsolute(getPieSliceLabel(),true);
setAutofit(getPieSliceLabel(),false);
setFontSize(getPieSliceLabel(),14);
setFontStyle(getLegendText(0),2);
setBorderColor(getX1MinorGrid(),new Color(133,133,133));
setBorderColor(getY1MinorGrid(),new Color(133,133,133));
setAutofit(getLegendText(0),false);
setFillColor(getChartBackground(),new Color(0,255,255));
setPieSliceDetach(getSeries(0),52);
setFontSizeAbsolute(getO1Label(0),true);
setAutofit(getO1Label(0),false);
setFontSize(getO1Label(0),12);
setMarkerDisplay(true);
setConnectLineMarkers(false);
setConnectScatterMarkers(false);
setO1LabelDisplay(true);
setO1AxisSide(0);
setO1MajorGridDisplay(true);
setO1MajorGridStyle(0);
setO1MinorGridDisplay(false);
setSeriesType(0,0);
setY1LabelDisplay(true);
setY1AxisSide(0);
setY1MajorGridDisplay(true);
setY1MajorGridStyle(0);
setY1MinorGridDisplay(false);
setPieFeelerTextDisplay(1);
setPieLabelDisplay(0);
setTextFormatPreset(getPieSliceLabel(),1);
setTextFormatPreset(getY1Label(),1);
setLegendDisplay(true);
setFontSizeAbsolute(getLegendText(),true);
ENDSTYLE
ON GRAPH SET BARNUMB OFF
ON GRAPH SET 3D OFF
ON GRAPH SET VZERO ON
ON GRAPH SET GRID ON
ON GRAPH SAVE AS GRAPH1 FORMAT GIF
END
GRAPH FILE CENTORD
SUM LINE_COGS LINEPRICE
ACROSS MONTH
ON GRAPH SET LOOKGRAPH VLINSTK
ON GRAPH SET GRAPHEDIT SERVER
ON GRAPH SET GRAPHSTYLE *
setGridStep(getY1MajorGrid(),1.0E8);
setGridStep(getY2MajorGrid(),4.0E7);
setTextWrap(getLegendText(0),true);
setDisplayBarAsPictograph(true);
setAutofit(getLegendText(0),false);
setFontSize(getLegendText(0),11);
setAutofit(getLegendText(1),false);
setFontSize(getLegendText(1),11);
setAutofit(getY1Label(),false);
setFontStyle(getLegendText(0),2);
setBorderColor(getX1MinorGrid(),new Color(133,133,133));
setBorderColor(getY1MinorGrid(),new Color(133,133,133));
setRect(getLegendArea(),new Rectangle(10901,-9500,4698,20800));
setAutofit(getLegendText(0),false);
setDataLineThickness(39);
setDepthAngle(19);
setDepthRadius(18);
setFillColor(getChartBackground(),new Color(0,255,255));
setFillColor(getFrame(),new Color(223,223,223));
setFillColor(getFrameSide(),new Color(191,191,191));
setFillColor(getFrameBottom(),new Color(179,179,179));
setRiserBarGroupSpacing(52);
setRiserWidth(31);
setScaleMax(getY1Axis(),5.0E8);
setScaleMax(getY2Axis(),2.8E8);
setScaleMin(getY2Axis(),0.0);
setSeriesType(getSeries(0),2);
setSeriesType(getSeries(1),2);
setFontSizeAbsolute(getO1Label(0),true);
setAutofit(getO1Label(0),false);
setFontSize(getO1Label(0),12);
setFontSizeAbsolute(getO1Label(1),true);
setAutofit(getO1Label(1),false);
setFontSize(getO1Label(1),12);
setFontSizeAbsolute(getO1Label(2),true);
setAutofit(getO1Label(2),false);
setFontSize(getO1Label(2),12);
setFontSizeAbsolute(getO1Label(3),true);
setAutofit(getO1Label(3),false);
setFontSize(getO1Label(3),12);
setFontSizeAbsolute(getO1Label(4),true);
setAutofit(getO1Label(4),false);
setFontSize(getO1Label(4),12);
setFontSizeAbsolute(getO1Label(5),true);
setAutofit(getO1Label(5),false);
setFontSize(getO1Label(5),12);
setFontSizeAbsolute(getO1Label(6),true);
setAutofit(getO1Label(6),false);
setFontSize(getO1Label(6),12);
setFontSizeAbsolute(getO1Label(7),true);
setAutofit(getO1Label(7),false);
setFontSize(getO1Label(7),12);
setFontSizeAbsolute(getO1Label(8),true);
setAutofit(getO1Label(8),false);
setFontSize(getO1Label(8),12);
setFontSizeAbsolute(getO1Label(9),true);
setAutofit(getO1Label(9),false);
setFontSize(getO1Label(9),12);
setFontSizeAbsolute(getO1Label(10),true);
setAutofit(getO1Label(10),false);
setFontSize(getO1Label(10),12);
setFontSizeAbsolute(getO1Label(11),true);
setAutofit(getO1Label(11),false);
setFontSize(getO1Label(11),12);
setMarkerDisplay(false);
setConnectLineMarkers(true);
setConnectScatterMarkers(true);
setO1LabelDisplay(true);
setO1AxisSide(0);
setO1MajorGridDisplay(true);
setO1MajorGridStyle(0);
setO1MinorGridDisplay(false);
setSeriesType(0,2);
setSeriesType(1,2);
setY1LabelDisplay(true);
setY1AxisSide(0);
setY1MajorGridDisplay(true);
setY1MajorGridStyle(0);
setY1MinorGridDisplay(false);
setPieFeelerTextDisplay(0);
setTextFormatPreset(getPieSliceLabel(),1);
setTextFormatPreset(getY1Label(),1);
setLegendDisplay(true);
setFontSizeAbsolute(getLegendText(),true);
setFontSizeAbsolute(getY1Label(),true);
setFontSize(getY1Label(),11);
setFontStyle(getY1Label(),2);
ENDSTYLE
ON GRAPH SET BARNUMB OFF
ON GRAPH SET 3D ON
ON GRAPH SET VZERO ON
ON GRAPH SET GRID ON
ON GRAPH SAVE AS GRAPH2 FORMAT GIF
END
SET COMPOUND  = OPEN NOBREAK
TABLE FILE CENTORD
SUM
     LINEPRICE
BY
     PLANT
HEADING
" <40 "
"Centord Report "
"by Quarter / Plant "
ON TABLE SET PAGE-NUM OFF
ON TABLE SET BYDISPLAY OFF
ON TABLE NOTOTAL
ON TABLE SET ONLINE-FMT PDF
ON TABLE SET STYLE *
UNITS=IN,
PAGESIZE='Letter',
LEFTMARGIN=0.500000,
RIGHTMARGIN=0.500000,
TOPMARGIN=0.000000,
BOTTOMMARGIN=0.000000,
SQUEEZE=ON,
ORIENTATION=LANDSCAPE,
$TYPE=REPORT,
FONT='TIMES NEW ROMAN',
SIZE=8,
COLOR=BLACK,
BACKCOLOR=NONE,
STYLE=NORMAL,
$TYPE=TITLE,
GRID=ON,
BACKCOLOR=SILVER,
$TYPE=REPORT,
IMAGE=GRAPH1.gif,
POSITION=(4.000000 0.700000),
SIZE=(3.200000 1.600000),
$TYPE=REPORT,
IMAGE=GRAPH2.gif,
POSITION=(4.000000 2.300000),
SIZE=(3.200000 1.600000),
$TYPE=HEADING, LINE=2, SIZE=10,STYLE=BOLD+ITALIC, JUSTIFY=CENTER, $ TYPE=HEADING, LINE=3, SIZE=10,STYLE=BOLD+ITALIC, JUSTIFY=CENTER, $ ENDSTYLE END
SET COMPOUND = NOBREAK
TABLE FILE CENTORD
SUM PRICE COST
BY
PLANT
ON TABLE SET PAGE-NUM OFF
ON TABLE SET BYDISPLAY OFF
ON TABLE NOTOTAL
ON TABLE SET ONLINE-FMT PDF
ON TABLE SET STYLE *
     UNITS=IN,
     PAGESIZE='Letter',
     LEFTMARGIN=0.500000,
     RIGHTMARGIN=0.500000,
     TOPMARGIN=0.000000,
     BOTTOMMARGIN=0.000000,
     SQUEEZE=ON,
     ORIENTATION=LANDSCAPE,
$
TYPE=REPORT,
FONT='TIMES NEW ROMAN',
SIZE=8,
COLOR=BLACK,
BACKCOLOR=NONE,
STYLE=NORMAL,
$TYPE=TITLE, BACKCOLOR=SILVER,
GRID=ON,$
ENDSTYLE
END
SET COMPOUND = CLOSE
TABLE FILE CENTORD
SUM
QUANTITY
LINEPRICE
BY
PLANT
ON TABLE SET PAGE-NUM OFF
ON TABLE SET BYDISPLAY OFF
ON TABLE NOTOTAL
ON TABLE SET ONLINE-FMT PDF
ON TABLE SET STYLE *
UNITS=IN,
PAGESIZE='Letter',
LEFTMARGIN=0.500000,
RIGHTMARGIN=0.500000,
TOPMARGIN=0.000000,
BOTTOMMARGIN=0.000000,
SQUEEZE=ON,
ORIENTATION=LANDSCAPE,
$TYPE=REPORT,
FONT='TIMES NEW ROMAN',
SIZE=8,
COLOR=BLACK,
BACKCOLOR=NONE,
STYLE=NORMAL,
$
TYPE=TITLE, BACKCOLOR=SILVER,
GRID=ON,$
ENDSTYLE
END| WebFOCUS |