Syntax: How to Partition Observations Into Clusters Based on the Nearest Mean Value
KMEANS_CLUSTER(number, percent, iterations, tolerance,
        [prefix1.]field1[, [prefix1.]field2 ...])
where:
- number
-
Integer
Is number of clusters to extract.
- percent
-
Numeric
Is the percent of training set size (the percent of the total data to use in the calculations). The default value is AUTO, which uses the internal default percent.
- iterations
-
Integer
Is the maximum number of times to recalculate using the means previously generated. The default value is AUTO, which uses the internal default number of iterations.
- tolerance
-
Numeric
Is a weight value between zero (0) and 1.0. The value AUTO uses the internal default tolerance.
- prefix1, prefix2
-
Defines an optional aggregation operator to apply to the field before using it in the calculation. Valid operators are:
- SUM. which calculates the sum of the field values. SUM is the default value.
- CNT. which calculates a count of the field values.
- AVE. which calculates the average of the field values.
- MIN. which calculates the minimum of the field values.
- MAX. which calculates the maximum of the field values.
- FST. which retrieves the first value of the field.
- LST. which retrieves the last value of the field.
Note: The operators PCT., RPCT., TOT., MDN., MDE., RNK., and DST. are not supported.
- field1
-
Numeric
Is the set of data to be analyzed.
- field2
-
Numeric
Is an optional set of data to be analyzed.
Example: Partitioning Data Values Into Clusters
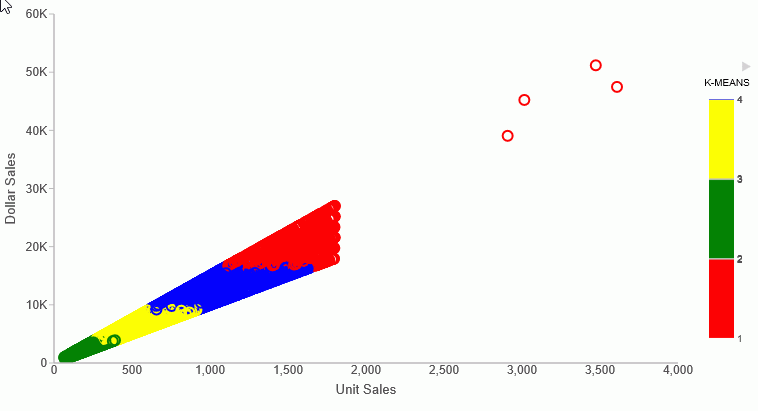
The following request partitions the DOLLARS field values into four clusters and displays the result as a scatter chart in which the color represents the cluster. The request uses the default values for the percent, iterations, and tolerance parameters by passing them as the value 0 (zero).
SET PARTITION_ON = PENULTIMATE
GRAPH FILE GGSALES
PRINT UNITS DOLLARS
COMPUTE KMEAN1/D20.2 TITLE 'K-MEANS'=  KMEANS_CLUSTER(4, AUTO, AUTO, AUTO, DOLLARS);
ON GRAPH SET LOOKGRAPH SCATTER
ON GRAPH PCHOLD FORMAT JSCHART
ON GRAPH SET STYLE *
INCLUDE=Warm.sty,$
type = data, column = N2, bucket=y-axis,$
type=data, column= N1, bucket=x-axis,$
type=data, column=N3, bucket=color,$
GRID=OFF,$
*GRAPH_JS_FINAL
colorScale: {
		colorMode: 'discrete',
		colorBands: [{start: 1, stop: 1.99, color: 'red'}, {start: 2, stop: 2.99, color: 'green'},
               {start: 3, stop: 3.99, color: 'yellow'}, {start: 3.99, stop: 4, color: 'blue'} ]
	}
*END
ENDSTYLE
END
The output is shown in the following image.
