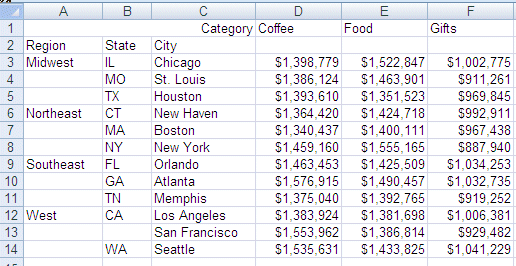
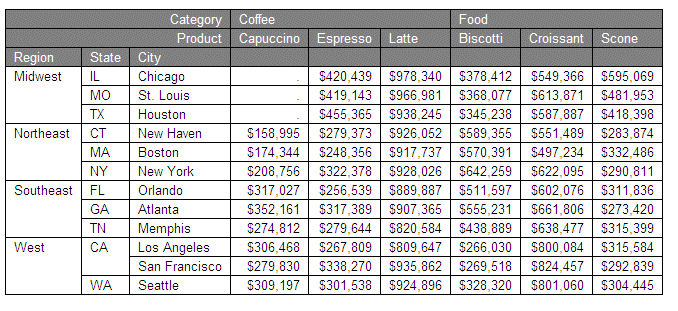
Features Added in FOCUS 7.7.06

In this section:

The following features were added as of FOCUS 7.7.06.

FORMAT XLSX

Reference:

With Excel 2007, Microsoft introduced enhanced worksheet functionality in a new workbook file format. The XLSX format supports most StyleSheet attributes, allowing for full report formatting. The computer on which the report is being displayed must have Microsoft Excel 2007 or higher installed.

The FOCUS procedure generates a new workbook containing a single worksheet with the report output containing your defined report elements (headings and subtotals), as well as StyleSheet syntax:

Reference: Building the XLSX Workbook File

Microsoft changed the format and structure of the Excel workbook in Excel 2007. The new .xlsx file is a binary compilation of a group of XML files. Generating this new file format using FOCUS is a two step process that consists of generating the XML files containing the report output and zipping the XML documents into the binary .xlsx format.

The zipping process requires code included in the webfocus.war file of the WebFOCUS client, which is deployed as the ibi_apps context root on an application server such as Tomcat.

You must have an installed version of the WebFOCUS Client so that ibi_apps is deployed. The application server must be running when you issue the HOLD FORMAT XLSX command in your report request. The WebFOCUS Client does not have to be running. Your request must point to the URL where ibi_apps is deployed using the SET EXCELSERVURL command:

SET EXCELSERVURL = http://servername:8080/ibi_apps

where:

servername

Is the name of the machine where the application server is running.

8080

Is the default port used by the WebFOCUS Client to communicate with the application server.

After the XLSX output file is generated, you must FTP it to your PC in binary mode.

Example: Generating FORMAT XLSX FORMULA Output

The following request generates an XLSX FORMULA output file. The host name for the machine on which the application server is running is myserver.

DYNAM ALLOC DD HOLD DA USER1.HOLD.XLSX SHR REU
SET EXCELSERVURL = http://myserver:8080/ibi_apps
TABLE FILE GGSALES
SUM DOLLARS UNITS
BY CATEGORY
ON TABLE COLUMN-TOTAL
ON TABLE HOLD FORMAT XLSX FORMULA
END

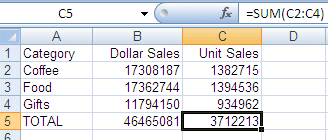
The output is shown in the following image. The Excel formula generated for the UNITS column-total is shown in the formula field at the top of the Worksheet:
Microsoft PowerPoint Presentation File Format (PPTX)

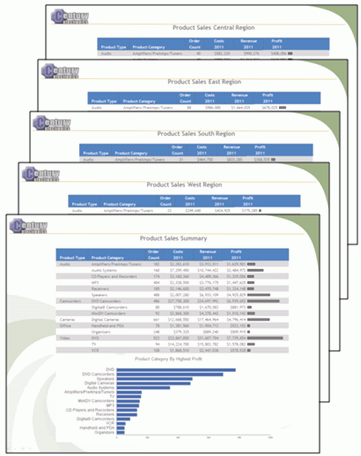
The PPTX file format can contain reports, graphs, and images with FOCUS styling features, as well as populate PowerPoint templates containing preset Slide Masters, styling, and other business content, as shown in the following image.

Using PowerPoint PPTX Display Format

In this section:

With PowerPoint (PPTX), Microsoft® introduced enhanced functionality in a new presentation file format.

The PPTX format generates fully styled reports in binary display format, which uses the same binary technology that is used for XLSX. When PPTX is specified as the output format, a PowerPoint presentation with a single slide that includes the report is created.

The FOCUS procedure generates a new presentation containing your defined report elements, such as headings and subtotals, as well as StyleSheet syntax, such as conditional styling and drill downs.

Additionally, you can add multiple graphs and images to a PowerPoint presentation. The PowerPoint output format can contain a variety of graphs positioned anywhere on a slide to create a visual layout.

Using PowerPoint PPTX Templates

How to:

You can place report output on a specific slide in a PowerPoint template. This enables you to populate existing presentations with preset Slide Masters, styling, and other business content.

Syntax: How to Create PowerPoint PPTX Report Output

ON TABLE {HOLD|SAVE} [AS name] FORMAT PPTX

where:

name

Is the name of the PowerPoint output file.

Example: Using a PowerPoint PPTX Template

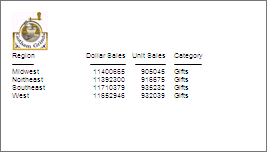
The following request against the GGSALES data source inserts a FOCUS report into a PowerPoint PPTX template named mytemplate.potx which is stored in the application directory:

TABLE FILE GGSALES
HEADING
" "
" "
" "
" "
" "
SUM DOLLARS UNITS CATEGORY 
BY  REGION
ON TABLE SET PAGE-NUM NOLEAD
ON TABLE NOTOTAL
ON TABLE HOLD FORMAT PPTX TEMPLATE 'mytemplate.potx' SLIDENUMBER 3
ON TABLE SET HTMLCSS ON
ON TABLE SET STYLE *
TYPE=REPORT, FONT=ARIAL, SIZE=10,$
TYPE=HEADING, image=gglogo.gif, POSITION=(0.000000 0.000000),$
ENDSTYLE
END

The output is:

Embedded TrueType Font Support Enhancement

You can selectively embed a subset of Unicode (Arial Unicode and MS Lucida Sans Unicode) or Non-Unicode (Tahoma, Times New Roman, Trebuchet MS, and Courier New) TrueType fonts into a PDF output file. The generated PDF file will contain only the characters required to render the document.

Displaying Superscripts On Data, Heading, and Footing Lines

How to:

Superscript characters are supported as a text style in text objects using HTML markup tags. The superscript markup tag is now supported in data columns, headings, and footings in HTML, PDF, and PS output formats. Superscript values can be defined within the data, added to virtual fields, or added to text strings displayed in headings and footings.

In order to activate the translation of the HTML markup tags, in the StyleSheet set MARKUP=ON for any report component that will display superscripts. Without this attribute, the markup tags will be treated as text, not tags.

Syntax: How to Display Superscripts on Report Data, Heading, and Footing Lines

If the tags are not within the data itself, create a field that contains the text to be used as a superscript. Also, turn markup tags on for the components that will display superscripts:

  • In a DEFINE or COMPUTE command, define a field that contains the text to be displayed as a superscript.

    For a DEFINE FILE command, the syntax is:

    DEFINE FILE ...field/An = <sup>text</sup>;
    END

    For a COMPUTE command or a DEFINE in a Master File, the syntax is:

    {COMPUTE|DEFINE} field/An = <sup>text</sup>;

    where:

    field

    Is the field to display with the superscript.

    n

    Is the length of the string defining the superscript, including the text to be used as the superscript and the opening and closing markup tags (<sup> and </sup>).

    text

    Is the text to be used as the superscript.

  • In the StyleSheet, set MARKUP=ON for any report component that will display superscripts:
    TYPE=component,MARKUP=ON ... ,$

    where:

    component

    Is one of the following report components: DATA, HEADING, FOOTING, SUBHEAD, SUBFOOT, TABHEADING, TABFOOTING.

Example: Displaying Superscripts in Data and Footing Lines in PDF Output

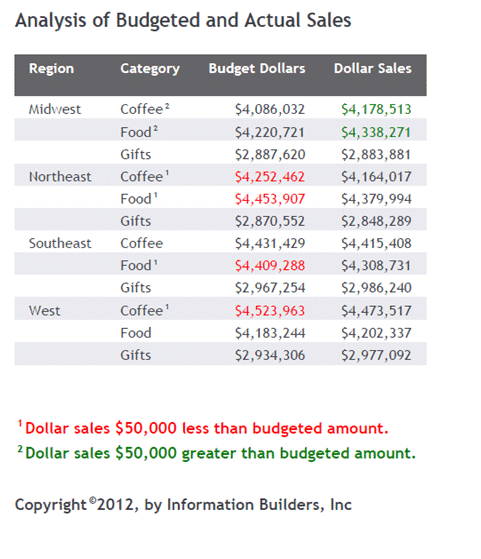
The following request against the GGSALES data source defines two fields that will display as superscripts. SUP1 and SUP2 consist of the numbers 1 and 2, respectively. SUPCOPY consists of a copyright symbol. Note that the difference is the syntax defined for a text value as opposed to a HEX value.

The COMPUTE command compares sales dollars to budgeted dollars. If the value calculated is less than a minimum defined, the superscript SUP1 is concatenated after the category name. If the value is greater, SUP2 is concatenated.

The superscript SUPCOPY is used to display the copyright symbol in the footing of the report.

The footing concatenates the superscript fields in front of their explanations.

In the StyleSheet, every component that will display a superscript has the attribute MARKUP=ON.

DEFINE FILE GGSALES
SUP1/A12= '<SUP>1</SUP>';
SUP2/A15= '<SUP>2</SUP>';
SUPCOPY/A20= '<SUP>'||HEXBYT(169,'A2')||'</SUP>';
END
TABLE FILE GGSALES
SUM
COMPUTE PROFIT/D12CM=DOLLARS-BUDDOLLARS; NOPRINT
COMPUTE SHOWCAT/A100=IF PROFIT LE -50000 THEN CATEGORY || SUP1
       ELSE IF PROFIT GT 50000 THEN CATEGORY || SUP2
           ELSE CATEGORY; AS Category
BUDDOLLARS/D12CM
DOLLARS/D12CM
BY REGION 
BY CATEGORY NOPRINT
HEADING
"Analysis of Budgeted and Actual Sales"
FOOTING
""
"<SUP1 Dollar sales $50,000 less than budgeted amount."
"<SUP2 Dollar sales $50,000 greater than budgeted amount."
""
"Copyright<SUPCOPY 2012, by Information Builders, Inc " 
ON TABLE SET HTMLCSS ON
ON TABLE SET SQUEEZE ON
ON TABLE SET PAGE-NUM OFF
ON TABLE HOLD FORMAT PDF
ON TABLE SET STYLE *
INCLUDE=ENDEFLT,$
TYPE=DATA,MARKUP=ON,$
TYPE=DATA,COLUMN=N5, COLOR=RED, WHEN=PROFIT LT -50000,$
TYPE=DATA,COLUMN=N6, COLOR=GREEN, WHEN=PROFIT GT 50000,$
TYPE=HEADING, JUSTIFY=LEFT,$
TYPE=FOOTING, MARKUP=ON, JUSTIFY=LEFT,$
TYPE=FOOTING, LINE=2,JUSTIFY=LEFT, COLOR=RED,$
TYPE=FOOTING, LINE=3,JUSTIFY=LEFT, COLOR=GREEN,$
END

The output is:

ROWOVERFLOW Enhancements for XLSX and EXL2K

In this section:

The following enhancements have been added to the ROWOVERFLOW feature that overcomes the Excel row limit for a Worksheet:

Overcoming the Excel 2003, 2007, and 2010 Row Limit Using Overflow Worksheets

How to:

Reference:

The maximum number of rows supported by Excel 2003 on a Worksheet is 65,536 (65K). The maximum number of rows supported by Excel 2007 and 2010 on a Worksheet is 1,048,576 (1MB). When you create an EXL2K or XLSX output file from a FOCUS report, the number of rows generated can be greater than this maximum.

To avoid creating an incomplete output file, you can have extra rows flow onto a new Worksheet, called an overflow Worksheet. The name of each overflow Worksheet will be the name of the original Worksheet appended with an increment number.

In addition, when the overflow Worksheet feature is enabled, you can set a target value for the maximum number of rows to be included on a Worksheet. By default, the row limit will be set to the default value for the LINES parameter (57).

Note: By default, when generating EXL2K or XLSX output, the FOCUS page heading and page footing commands generate only Worksheet headings and Worksheet footings.

Syntax: How to Enable Overflow Worksheets

Add the ROWOVERFLOW attribute to your FOCUS StyleSheet

TYPE=REPORT, ROWOVERFLOW={ON|OFF|PBON}, [ROWLIMIT={n|MAX}...

where:

ON

Enables overflow Worksheets.

OFF

Disables overflow Worksheets. OFF is the default value.

PBON

Inserts FOCUS page breaks that display the page heading, footing, and column titles at the appropriate places within the Worksheet rows. This option does not cause a new Worksheet to start when a FOCUS page break occurs.

ROWLIMIT=n

Sets a target value for the number of rows to be included on a Worksheet to n rows. The default value is the LINES value (by default, 57).

ROWLIMIT=MAX

Sets a target value for the number of rows to be included on a Worksheet to 65,000 rows for EXL2K output or 1,048,000 rows for XLSX output.

This attribute will work only with EXL2K or XLSX output. For all other output types, the ROWOVERFLOW StyleSheet attribute is ignored, and data flow is not affected.

Reference: Usage Notes for EXL2K and XLSX Overflow Worksheets

  • The report heading is placed once at the start of the first sheet. The report footing is placed once at the bottom of the last overflow sheet.
  • Unless the PBON setting is used, Worksheet headings and column titles are repeated at the top of the original sheet and each subsequent overflow sheet. Worksheet footings are placed at the bottom of the original sheet and each subsequent overflow sheet. The data values are displayed on the top data row of each overflow sheet as they would be on a standard new page.
  • Report total lines are displayed at the bottom of the last overflow sheet directly above the final page and table footings.
  • Subheadings, subfootings, and subtotal lines display within the data flow as normal. No special consideration is made to retain groupings within a given sheet.
  • If ROWOVERFLOW=PBON, the page headings and footings and column titles display within the Worksheet when a FOCUS command causes a page break.
  • For EXL2K output, if the ROWOVERFLOW attribute is specified in the StyleSheet and ROWLIMIT is greater than 65K, the following message is presented and no output file is generated:
    (FOC3313) The row limit for EXL2K worksheets is 65536.

    For XLSX output, if the ROWOVERFLOW attribute is specified in the StyleSheet and ROWLIMIT is greater than 1MB, the following message is presented and no output file is generated:

    (FOC3338) The row limit for EXCEL XLSX worksheets is 1048576.
  • Output types that contain formula references (EXL2K PIVOT and EXL2K FORMULA) are not supported, as formula references are not automatically updated to reflect placement on new overflow worksheets.
  • The overflow Worksheet feature applies to rows only, not columns. A new Worksheet will not automatically be created if a report generates more than the Excel 2003 limit of 256 columns or the Excel 2007/2010 limit or 16,384 columns.
  • ROWOVERFLOW is supported for compound layout reports in EXL2K and BYTOC reports for both EXL2K and XLSX.
  • As named ranges in Excel cannot run across multiple Worksheets, the IN-RANGES phrase that defines named ranges in the resulting workbook is not supported with the ROWOVERFLOW feature. When they exist together in the same request, ROWOVERFLOW takes precedence and the IN-RANGES phrase is ignored.
Example: Creating Overflow Worksheets With EXL2K Report Output

The following request creates EXL2K report output with overflow Worksheets. The ROWOVERFLOW=ON attribute in the StyleSheet activates the overflow feature. Without this attribute, one Worksheet would have been generated instead of three.

TABLE FILE GGSALES
-* ****Report Heading****
ON TABLE SUBHEAD
"SALES BY REGION, CATEGORY, AND PRODUCT"
" "
-* ****Worksheet Heading****
HEADING
"SALES REPORT WORKSHEET <TABPAGENO"
" "
-* ****Worksheet Footing****
FOOTING
" "
"END OF WORKSHEET <TABPAGENO"
PRINT DOLLARS UNITS BUDDOLLARS BUDUNITS
BY REGION
BY CATEGORY
BY PRODUCT
BY DATE
-* ****Subfoot****
ON REGION SUBFOOT
" "
" End of Region <REGION"
" "
-* ****Subhead****
ON REGION SUBFOOT
" "
" End of Region <REGION"
" "
-* ****Report Footing****
ON TABLE SUBFOOT
" "
"END OF REPORT"
ON TABLE HOLD FORMAT EXL2K
ON TABLE SET STYLE *
TYPE=REPORT, TITLETEXT=EXLOVER, ROWOVERFLOW=ON, ROWLIMIT=2000,$
ENDSTYLE
END

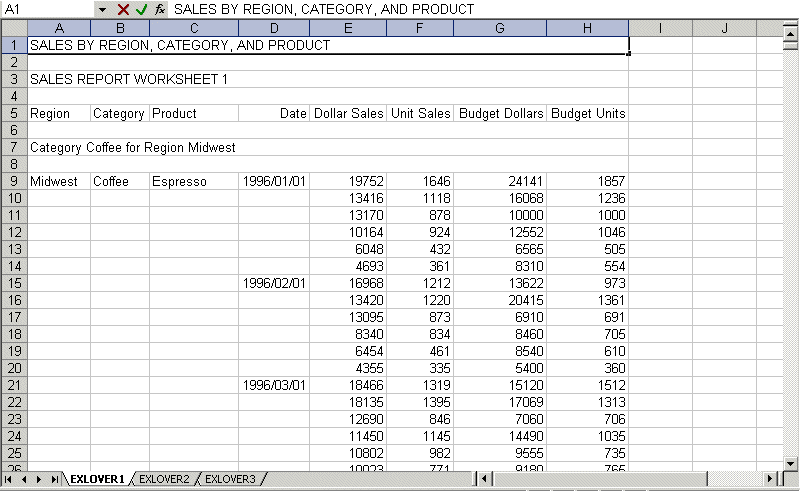
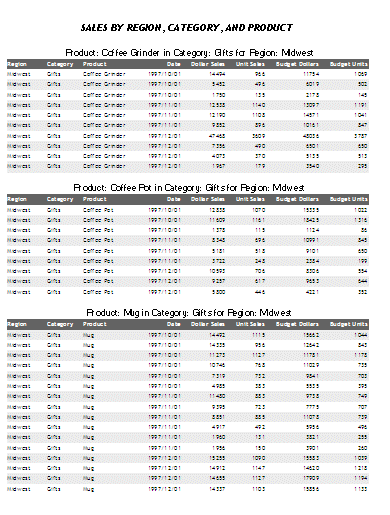
The report heading displays on the first Worksheet only. The page heading and column titles display on each Worksheet, and the subhead and subfoot display whenever the associated sort field changes value. The following image shows the top of the first Worksheet, displaying the report heading, page heading, column titles, and first subhead.


Note that the TITLETEXT attribute in the StyleSheet specified the name EXLOVER, so the three Worksheets were generated with the names EXLOVER1, EXLOVER2, and EXLOVER3. If there had been no TITLETEXT attribute, the sheets would have been named SHEET1, SHEET2, and SHEET3.

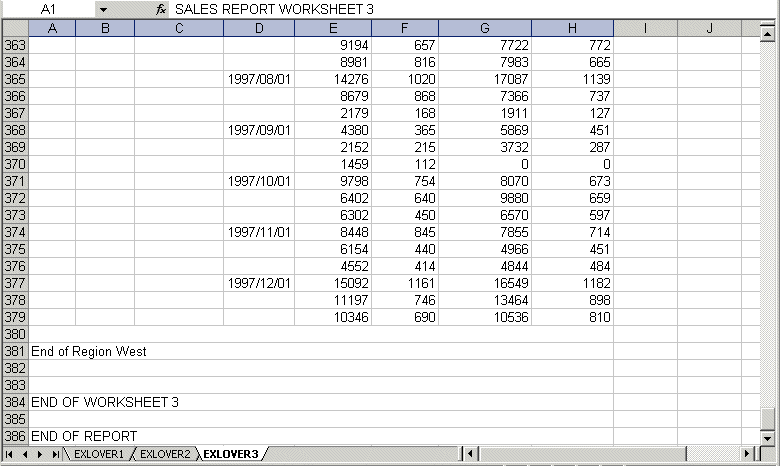
The Worksheet footing displays at the bottom of each Worksheet and the report footing displays at the bottom of the last Worksheet. The following image shows the bottom of the last Worksheet, displaying the last subfoot, the page footing, and the report footing.


Example: Creating Overflow Worksheets With FOCUS Page Breaks

The following request creates XLSX report output with overflow Worksheets. The ROWOVERFLOW=PBON attribute in the StyleSheet activates the overflow feature, and the ROWLIMIT=250 sets the maximum number of rows in each Worksheet to approximately 250. Without this attribute, one Worksheet would have been generated. The PRODUCT sort phrase specifies a page break.

TABLE FILE GGSALES
-* ****Report Heading****
ON TABLE SUBHEAD
"SALES BY REGION, CATEGORY, AND PRODUCT"
" "
PRINT DOLLARS UNITS BUDDOLLARS BUDUNITS
BY REGION 
BY HIGHEST CATEGORY 
BY PRODUCT PAGE-BREAK
BY DATE
WHERE DATE GE '19971001'
-* ****Page Heading****
HEADING
" Product: <PRODUCT in Category: <CATEGORY for Region: <REGION"
-* ****Page Footing****
FOOTING
" "
-* ****Report Footing****
ON TABLE SUBFOOT
" "
"END OF REPORT"
ON TABLE SET BYDISPLAY ON
ON TABLE HOLD FORMAT XLSX
ON TABLE SET STYLE *
INCLUDE=endeflt,TITLETEXT=EXLOVER, ROWOVERFLOW=PBON, ROWLIMIT=250,
$
ENDSTYLE
END

The report heading displays on the first Worksheet only. The page heading, footing, and column titles display on each Worksheet and at each FOCUS page break (each time the product changes), and the subhead and subfoot display whenever the associated sort field changes value. The following image shows the top of the first Worksheet.

Using EXL2K Formula With Prefix Operators

EXL2K FORMULA output supports prefix operators that are used on summary lines generated by FOCUS commands, such as SUBTOTAL and RECOMPUTE. Where a corresponding formula exists in Excel, these prefix operators are translated into the equivalent Excel summarization formula. The results of prefix operators used directly against retrieved data continue to be passed to Excel as values, not formulas.

The following table identifies the prefix operators supported by EXL2K FORMULA when used on summary lines, and the Excel formula equivalent placed in the generated worksheet.

Prefix Operator

Excel Formula Equivalent

SUM.

=SUM()

AVE.

=AVERAGE()

CNT.

=COUNT()

MIN.

=MIN()

MAX.

=MAX()

The following prefix operators are not translated to formulas when used on summary lines in EXL2K FORMULA.

Note:

Example: Using a Summary Prefix Operator With Format EXL2K FORMULA

In the following request against the GGSALES data source, the RECOMPUTE command for the REGION sort field calculates the maximum of the aggregated DOLLARS field and the minimum of the aggregated BUDDOLLARS field:

TABLE FILE GGSALES
SUM UNITS DOLLARS BUDDOLLARS
AND COMPUTE DIFF/I10= DOLLARS-BUDDOLLARS;
BY REGION
BY CATEGORY
WHERE CATEGORY EQ 'Food' OR 'Coffee'
WHERE REGION EQ 'West' OR 'Midwest'
ON REGION RECOMPUTE MAX. DOLLARS MIN. BUDDOLLARS DIFF
ON TABLE HOLD FORMAT EXL2K FORMULA
END

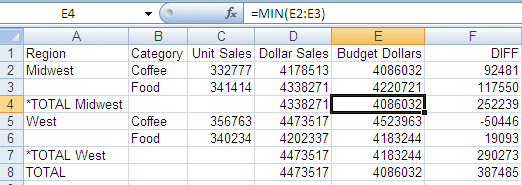
On the output, the cell that represents the recomputed DOLLARS for the Midwest region has been generated as the formula =MIN(E2:E3).

Styling Tags for SUBTOTAL and GRANDTOTAL Lines

How to:

The tag is the text that is displayed in the leftmost portion of each SUBTOTAL and GRANDTOTAL row in a report. The tag is used to identify the type of data represented within this row. The text used to generate this tag can be customized by adding an AS name to the SUBTOTAL syntax.

You can define styling for the subtotal and grand total tag separately from the rest of the row. Text attributes available for the tag, including font, color, size, and style, can be used to differentiate and highlight the tags. Additionally, styling can be applied that turns tags into drill-down links.

Styling is supported for text attributes only. Cell or column features such as borders, background color, or justification are not supported.

This feature is available for PDF, DHTML, PS, HTML, AHTML, XLSX, and EXL2K formats.

Syntax: How to Style Subtotal and Grand Total Tags

TYPE={SUBTOTAL|GRANDTOTAL}, OBJECT=TAG,
   [FONT=font], [SIZE=size], [STYLE=style],
   [COLOR={color|RGB({r g b|#hexcolor})],
   [drilltype=drillparms], $

where:

font

Is the name of the font.

size

Is the point size of the font.

style

Is the font style, for example, bold, italic, or bold+italic.

color

Is a color name.

r g b

Specifies the font color using a mixture of red, green, and blue.

(r g b) is the desired intensity of red, green, and blue, respectively. The values are on a scale of 0 to 255, where 0 is the least intense and 255 is the most intense. Note that using the three color components in equal intensity results in shades of gray.

#hexcolor

Is the hexadecimal value for the color. For example, FF0000 is the hexadecimal value for red. The hexadecimal digits can be in uppercase or lowercase and must be preceded by a pound sign (#).

drilltype

Is any valid drill-down attribute, for example, URL=. For information about drill-down links, see the Creating Reports manual.

drillparms

Are valid attribute values for the type of drill down.

Example: Styling SUBTOTAL and GRANDTOTAL Tags

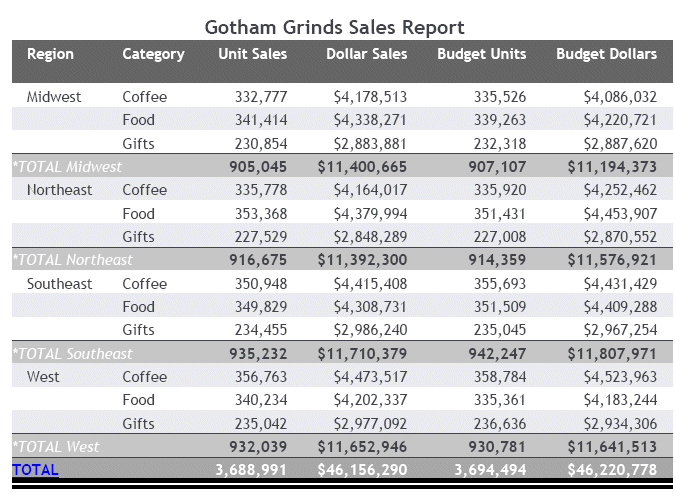
The following request against the GGSALES data source generates subtotal and grand total rows. The tags for the subtotal rows are in italics and are white. The tag for the grand total row has a drill-down link to a URL:

TABLE FILE GGSALES  
SUM UNITS/D8C DOLLARS/D12CM BUDUNIT/D8C BUDDOLLARS/D12CM
BY REGION
BY CATEGORY
ON REGION SUBTOTAL
HEADING
"Gotham Grinds Sales Report"
ON TABLE SET HTMLCSS ON
ON TABLE HOLD FORMAT PDF
ON TABLE SET DROPBLNKLINE ALL
ON TABLE SET PAGE-NUM OFF
ON TABLE SET STYLE *  
INCLUDE=ENDEFLT,$ 
TYPE=SUBTOTAL, OBJECT=TAG,STYLE=ITALIC,COLOR=WHITE,$
TYPE=GRANDTOTAL, BACKCOLOR='LIGHT GREY',$
TYPE=GRANDTOTAL, OBJECT=TAG,URL='http://www.informationbuilders.com',$
ENDSTYLE   
END

The output is:

Conditional Styling Based on ACROSS Values

FOCUS supports using ACROSS values to define conditional styling within the report. ACROSS values can now be used as part of the conditional expressions used to define styling attributes for each cell in the table.

Example: Conditionally Styling an ACROSS Value

The example below demonstrates how the ACROSS value can be referenced using either the ACROSS field name or the ACROSS column designator (A1, A2).

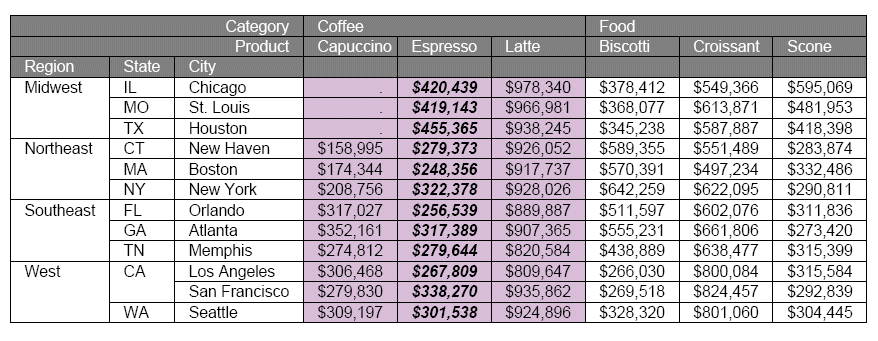
In this example, the ACROSS values are used in conditional styling to set a unique backcolor for all ACROSS columns in the Category Coffee, and additional font styling for the Espresso ACROSS column.

SET ACROSSTITLE=SIDE
TABLE FILE GGSALES
SUM DOLLARS/I8M AS ''
BY REGION
BY ST
BY CITY
ACROSS CATEGORY
ACROSS PRODUCT
WHERE CATEGORY EQ 'Coffee' OR 'Food';
ON TABLE SET PAGE-NUM NOPAGE
ON TABLE NOTOTAL
ON TABLE HOLD FORMAT PDF
ON TABLE SET HTMLCSS ON
ON TABLE SET STYLE *
SQUEEZE=ON,UNITS=IN,ORIENTATION=PORTRAIT,$
TYPE=REPORT,FONT='ARIAL',SIZE=10,BORDER=LIGHT,$
TYPE=ACROSSTITLE,COLOR=WHITE, BACKCOLOR=GREY,$
TYPE=ACROSSVALUE,COLOR=WHITE, BACKCOLOR=GREY,$ 
TYPE=TITLE,COLOR=WHITE, BACKCOLOR=GREY,$
TYPE=DATA, ACROSSCOLUMN=DOLLARS, BACKCOLOR=THISTLE, WHEN=CATEGORY EQ 'Coffee',$
TYPE=DATA, ACROSSCOLUMN=DOLLARS, STYLE=BOLD+ITALIC, WHEN=A2 EQ 'Espresso', $
ENDSTYLE
END

The output is:

SET ACROSSTITLE=SIDE Enhancements

The SET ACROSSTITLE=SIDE command:

Example: Creating an ACROSSTITLE=SIDE Report With XLSX Report Output

The following request against the GGSALES data source places the ACROSS titles next to the ACROSS values and holds the output in XLSX format.

SET ACROSSTITLE=SIDE
TABLE FILE GGSALES
SUM
DOLLARS/I8M AS ''
BY REGION
BY ST
BY CITY
ACROSS CATEGORY
ON TABLE SET PAGE-NUM NOPAGE
ON TABLE NOTOTAL
ON TABLE HOLD FORMAT XLSX
ON TABLE SET HTMLCSS ON
ON TABLE SET STYLE *
UNITS=IN, SQUEEZE=ON, ORIENTATION=PORTRAIT, $
TYPE=REPORT, FONT='ARIAL', SIZE=10, BORDER=LIGHT,$
ENDSTYLE
END

On the output, the ACROSS title CATEGORY displays to the left of its ACROSS values.

Example: Specifying Background Color for ACROSS Values With ACROSSTITLE=SIDE

The following request against the GGSALES data source places the ACROSS titles next to the ACROSS values and sets matching styling of font color and backcolor for the ACROSSTITLES, ACROSSVALUES, and column titles to white text on grey background color.

SET ACROSSTITLE=SIDE
TABLE FILE GGSALES
SUM DOLLARS/I8M AS ''
BY REGION
BY ST
BY CITY
ACROSS CATEGORY
ACROSS PRODUCT
WHERE CATEGORY EQ 'Coffee' OR 'Food';
ON TABLE SET PAGE-NUM NOPAGE
ON TABLE NOTOTAL
ON TABLE HOLD FORMAT HTML
ON TABLE SET HTMLCSS ON
ON TABLE SET STYLE *
SQUEEZE=ON,UNITS=IN,ORIENTATION=PORTRAIT,$
TYPE=REPORT,FONT='ARIAL',SIZE=10,BORDER=LIGHT,$
TYPE=ACROSSTITLE,COLOR=WHITE, BACKCOLOR=GREY,$
TYPE=ACROSSVALUE,COLOR=WHITE, BACKCOLOR=GREY,$ 
TYPE=TITLE,COLOR=WHITE, BACKCOLOR=GREY,$
ENDSTYLE
END

The output has a grey background color and white text for the ACROSS titles, ACROSS values, and column titles.

Reading a Field Containing Delimited Values as individual Rows

How to:

A field that contains a list of delimited values (such as email addresses separated by spaces) can now be pivoted to be read as individual rows when an additional segment is added with SEGSUF=DFIX (Delimited Flat File).

Previously, once the segment was added, it was not possible to change the row or record delimiter. Now they can be edited.

Syntax: How to Read a Field Containing Delimited Values as Individual Rows

In the Master File, add a segment definition with SEGTYPE=S0, SEGSUF=DFIX, and a POSITION attribute that points to the field with delimited values.

SEGNAME=parentseg, SUFFIX=suffix, SEGTYPE=S1,$
 FIELD=FIELD1,  ...,$
   ...
FIELD=delimitedfield, ALIAS=alias1, USAGE=usage, ACTUAL=actual,$
   ...
 SEGNAME=dfixsegname, PARENT=parentseg, SUFFIX=DFIX, POSITION=delimitedfield,$
  FIELD=name_for_pieces_of_field, ALIAS=alias2, USAGE=usageACTUAL=actual,$
   ...

Create an Access File that specifies the row delimiter and any other DFIX attributes for the DFIX segment.

 SEGNAME=dfixsegname, RDELIMITER='delimiter', $

When you issue a request, the field will be treated as separate rows based on the delimiter.

Example: Reading a Field Containing Delimited Values as Individual Rows

The following file named COUNTRYL.FTM contains country names and the longitude and latitude values of their capitals, The longitude and latitude values are stored as a single field named LNGLAT, separated by a comma:

Argentina      -64.0000000,-34.0000000
Australia      133.0000000,-27.0000000
Austria        13.3333000,47.3333000
Belgium        4.0000000,50.8333000
Brazil         -55.0000000,-10.0000000
Canada         -95.0000000,60.0000000
Chile          -71.0000000,-30.0000000
China          105.0000000,35.0000000
Colombia       -72.0000000,4.0000000
Denmark        10.0000000,56.0000000
Egypt          30.0000000,27.0000000
Finland        26.0000000,64.0000000
France         2.0000000,46.0000000
Germany        9.0000000,51.0000000
Greece         22.0000000,39.0000000
Hungary        20.0000000,47.0000000
India          77.0000000,20.0000000
Ireland        -8.0000000,53.0000000
Israel         34.7500000,31.5000000
Italy          12.8333000,42.8333000
Japan          138.0000000,36.0000000
Luxembourg     6.1667000,49.7500000
Malaysia       112.5000000,2.5000000
Mexico         -102.0000000,23.0000000
Netherlands    5.7500000,52.5000000
Norway         10.0000000,62.0000000
Philippines    122.0000000,13.0000000
Poland         20.0000000,52.0000000
Portugal       -8.0000000,39.5000000
Singapore      103.8000000,1.3667000
South Africa   24.0000000,-29.0000000
South Korea    127.5000000,37.0000000
Spain          -4.0000000,40.0000000
Sweden         15.0000000,62.0000000
Switzerland    8.0000000,47.0000000
Taiwan         121.0000000,23.5000000
Thailand       100.0000000,15.0000000
Tunisia        9.0000000,34.0000000
Turkey         35.0000000,39.0000000
United Kingdom -.1300000,51.5000000
United States  -97.0000000,38.0000000

Following is the original Master File COMMA1.

FILENAME=COMMA1  , SUFFIX=FIX, IOTYPE=STREAM,
 DATASET=appname/countryl.ftm, $
   SEGNAME=COU, SEGTYPE=S1, $
     FIELDNAME=COUNTRY, ALIAS=E01, USAGE=A15, ACTUAL=A15, $
     FIELDNAME=LNGLAT, ALIAS=LNGLAT,USAGE=A25, ACTUAL=A25, $

Following is the COMMA2 Master File with the DFIX segment added.

FILENAME=COMMA2  , SUFFIX=FIX, IOTYPE=STREAM,
 DATASET=appname/countryl.ftm, $
   SEGNAME=COU, SEGTYPE=S1, $
     FIELDNAME=COUNTRY, ALIAS=E01, USAGE=A15, ACTUAL=A15, $
 $   FIELDNAME=LNGLAT, ALIAS='$_.LNGLAT',USAGE=A25, ACTUAL=A25, $
     FIELDNAME=LNGLAT, ALIAS=LNGLAT,USAGE=A25, ACTUAL=A25, $
   SEGNAME = COMMA2, SEGTYPE=S0, SEGSUF=DFIX,PARENT=COU,POSITION=LNGLAT,$
     FIELD=COORD, ALIAS = XY, USAGE=A25, ACTUAL=A25,$

Following is the COMMA2 Access File.

SEGNAME=COMMA2, RDELIMITER=',', HEADER=NO, PRESERVESPACE=NO, $

The following request uses the COMMA2 Master File to print the values.

TABLE FILE COMMA2
PRINT COORD      
BY COUNTRY 
END

On the output, the LNGLAT field has been treated as two separate records. The partial output follows:

COUNTRY          COORD      
-------          -----      
Argentina        -64.0000000 
                 -34.0000000 
Australia        133.0000000
                 -27.0000000
Austria          13.3333000 
                 47.3333000 
Belgium          4.0000000  
                 50.8333000 
Brazil           -55.0000000
                 -10.0000000
Canada           -95.0000000
                 60.0000000 
Chile            -71.0000000
                 -30.0000000
China            105.0000000
                 35.0000000 
Colombia         -72.0000000

Information Builders