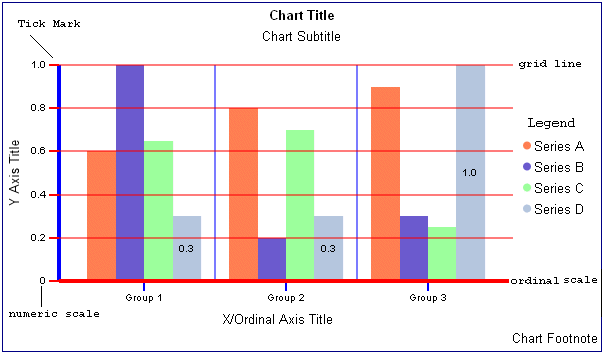
The following diagram shows the components of a chart.
With a few exceptions, each series represents the set of values for one field in the request, and each group represents all series values related to one sort field value.
| Information Builders |