Features Added in FOCUS 7.7.07

In this section:

The following features were added as of FOCUS 7.7.07.

Additional Support for Alignment Grid

The HEADALIGN=BODY (Alignment Grid) feature has been expanded to support the following additional formats: PPTX and DHTML. The HEADALIGN=BODY feature enables you to insert a grid of cells in a heading to support more sophisticated styling.

For more information on the HEADALIGN=BODY feature, see the Creating Reports manual.

Defining Internal Borders in an Alignment Grid

The BORDERALL feature allows for the definition of internal borders within a HEADALIGN=BODY (Alignment Grid) element of a report.

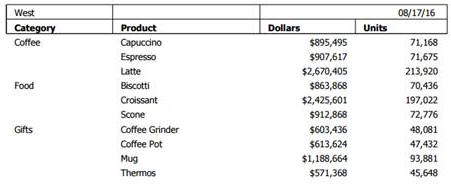
The following example shows a DHTML request against the GGSALES data source. The request contains a subhead with HEADALIGN=BODY and BORDERALL=ON. The alignment grid in the subhead aligns with the data, and each item within the subhead is presented as fully bordered individual cells.

TABLE FILE GGSALES
SUM DOLLARS/D12CM AS '' UNITS/D12C AS ''
BY REGION PAGE-BREAK NOPRINT
BY CATEGORY AS ''
BY PRODUCT AS ''
ON REGION SUBHEAD
"<REGION <+0> &DATE <+0> "
"Category<+0>Product<+0>Dollars<+0>Units"
ON REGION SUBFOOT
""
ON TABLE PCHOLD FORMAT DHTML
WHERE REGION EQ 'West';
ON TABLE SET STYLE *
TYPE=REPORT, LEFTMARGIN=.75,RIGHTMARGIN=1,FONT=TAHOMA,SIZE=10,GRID=OFF,$
TYPE=SUBHEAD,HEADALIGN=BODY,BORDERALL=ON,$
TYPE=SUBHEAD,LINE=1,ITEM=3,COLSPAN=2, JUSTIFY=RIGHT, $
TYPE=SUBHEAD,LINE=2,STYLE=BOLD,$
END

The output is:

For more information on how the HEADALIGN=BODY and BORDERALL features work together, see the Creating Reports manual.

Enhancements to PPTX Output Format

In this section:

The following are enhancements to the PPTX output format.

PNG Charts Embedded in Slides

The output image format for charts embedded in slides has been changed from JPG to PNG. PNG images are preferred as they produce better quality graph images, especially when displaying gradients, as well as provide support for transparency.

The PPTXGRAPHTYPE attribute enhances the quality of charts embedded into PowerPoint (PPTX) slides. As of Release 8.2.01M, you can use the PNG output format to enhance the image and text quality and support transparency.

This is useful for a number of important scenarios, including use of templates with background color and for overlapping a chart with other components and drawing objects.

The syntax is:

SET PPTXGRAPHTYPE={PNG|PNG_NOSCALE|JPEG}

where:

PNG

Scales the PNG image to twice its dimensions to get significantly improved quality. This may cause problems if you have non-scalable items in the chart, such as text with absolute point sizes (including embedded scales headings). The output file is also larger due to the larger bitmap. Text within the chart is noticeable sharper than the legacy JPEG format.

PNG preserves font sizes in the chart when it is internally rescaled for increased resolution. It converts absolute font sizes set in the stylesheet (*GRAPH_SCRIPT) to sizes expressed in virtual coordinates (which are relative to the dimensions of the chart) and generates font sizes for embedded headings and footings in virtual coordinates.

PNG_NOSCALE

Renders in PNG, but does not scale. This produces slightly better quality than JPEG. Going from JPEG to PNG_NOSCALE makes the chart sharper, but has only a slight effect on the text.

JPEG

Indicates legacy format. This is the default value.

For more information, see the Creating Reports manual.

PPTX Template Masters and Slide Layouts for Expanded Styling

A Microsoft PPTX template can contain one or more Slide Masters, defining a variety of different Slide Layouts. A Slide Master is the top slide in a hierarchy of slides that stores information about the theme and Slide Layouts of a presentation, including the background, color, fonts, effects, placeholder sizes, and positioning. You can incorporate two or more different styles or themes, such as backgrounds, color schemes, fonts, and effects, by inserting an individual Slide Master into the template for each different theme.

Note: Additional information on Microsoft PowerPoint Slide Layouts is available in an article titled What is a slide layout? on the Microsoft support site.

By default, the first Slide Layout in the first Slide Master is applied to slides on which FOCUS data is displayed.

With this new feature, FOCUS enables the developer to select any Slide Layout in any Slide Master in a PowerPoint template (POTX/POTM) or Presentation file (PPTX/PPTM). One Slide Layout may be applied to a slide or slides, displaying the output of a standard report, while one or different Slide Layouts may be applied to each Page Layout in a PPTX formatted Compound Document. The FOCUS generated output is placed on top of the styling on the selected Slide Layout.

For more information, see the Creating Reports manual.

Support for Page Size and Orientation

You can select the page size and orientation (Portrait or Landscape) for a PPTX formatted report, using the PAGESIZE and ORIENTATION style sheet attributes.

For more information, see the Creating Reports manual.

Enhanced PDF Support for JPG Compression

How to:

The compression algorithm used for JPG images embedded in PDF documents has been enhanced to generate considerably smaller PDF files, and to allow users to control elements of the JPEG compression method. The following new SET commands allow users to select the compression methodology (SET JPEGENCODE) and the image quality (SET JPEGQUALITY).

Syntax: How to Select the Compression Algorithm

SET JPEGENCODE = [FLATE|DCT]

where:

FLATE

Fixed quality defined

Is a compression method that allows images within PDF files to be individually compressed. This method is the default for FOCUS 7.7.03 through FOCUS 7.7.06.

DCT

Discrete Cosine Transform

Is a compression method, introduced in FOCUS 7.7.07, which allows for the designation of the percentage of quality to retain. This method is the default in FOCUS 7.7.07.

Note: In some images, quality loss is not noticeable when higher degrees of compression are applied. Generally, the higher the compression applied, the lower the image quality. Use SET JPEGQUALITY with the DCT setting to set the quality value.

Syntax: How to Select the Image Quality

SET JPEGQUALITY = n

where:

n

Is the percentage of quality used with the DCT setting. This value can be from1-100. The default value is 100, where no quality is lost and minimal compression is applied.

Defining Hyperlink Colors

How to:

You can use the HYPERLINK-COLOR attribute to designate a color for a hyperlink within a report. This applies to all hyperlinks generated in the report. You can define a single color for the entire report or different colors for each individual element.

Syntax: How to Set Hyperlink Colors

TYPE = type, HYPERLINK-COLOR = color

where:

type

Is the report component you wish to affect. You can apply this keyword to the entire report using TYPE=REPORT. The attribute can also individually be set for any other element of the report.

color

Can use any style sheet supported color value designation.

For more information, see the Creating Reports manual.

Enhanced Implementation of Peer Graphs

In this section:

The following are enhancements to peer graphs.

HEX and RGB Color Designations

For HTML output format, in addition to named colors, you can now use hex and RGB for color designations in a StyleSheet.

The syntax is:

GRAPHCOLOR={color|RGB({r g b|#hexcolor}}

For more information, see the Creating Reports manual.

Setting a Color for Data Visualization Bar Graphs

For all output formats, you can use the GRAPHCOLORNEG StyleSheet attribute to set a color for the data visualization bar graphs that represent negative values.

The syntax is:

GRAPHNEGCOLOR={color|RGB({r g b|#hexcolor}}

For more information, see the Creating Reports manual.


Information Builders